Repository navigation
feat: separate experimental data from MCP, REST and UI defaults - #439
Conversation


aaf2a2d to
02825f1
Compare
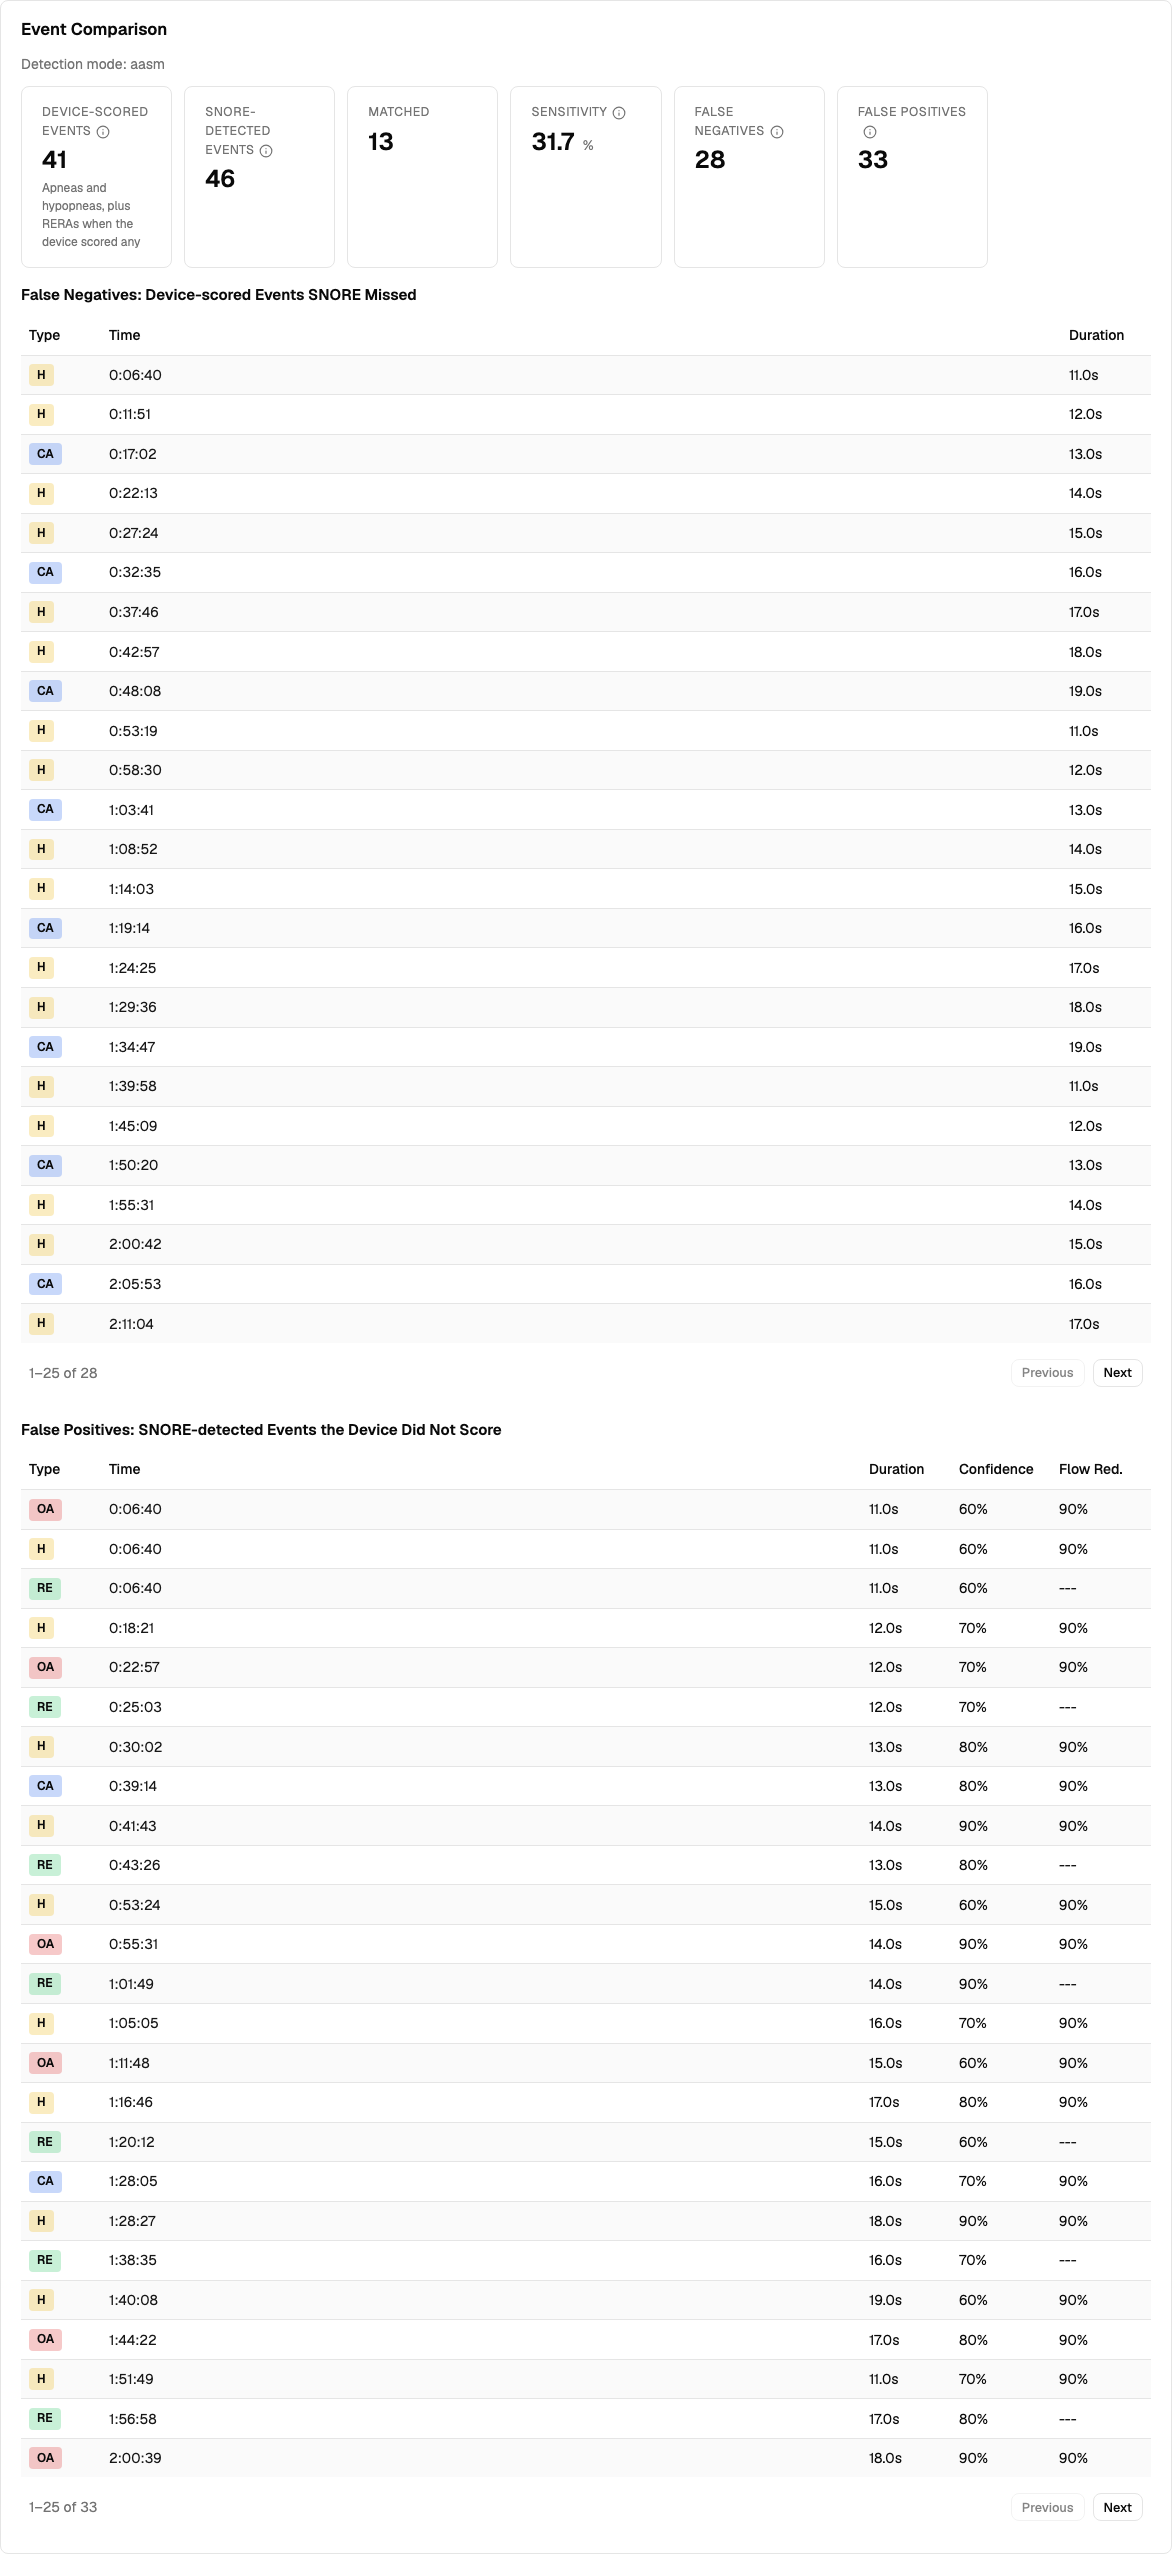
`GET /sessions/{id}/events/match` reports 0 matched. It adds the stored
`timestamp_start` to each SNORE event's relative time and compares the
result with absolute device times, but `timestamp_start` is `0.0` on
stored analysis results, so nothing lines up. On all 205 analyzed
sessions I checked locally it matched nothing, which is the 0 matched
and 0% sensitivity on Event Explorer, and it also made every device
event a false negative and every SNORE event a false positive.

`/waveforms/compare` has the right time base but disagrees with it in
other ways: it uses any-match false negatives, counts every device event
type in `machine_event_count`, has no matched count, and hardcodes the 5
s tolerance.

This PR makes `compare_events` the one implementation and deletes
`/events/match`. It now pools apneas and hypopneas on both sides and
uses `match_events_by_start_time` with `EVENT_MATCH_TOLERANCE_SECONDS`,
the batch-validation matcher, so each event is in at most one pair. The
result gains `matched_events`, the name `EventValidationResult` already
uses. Matched and Sensitivity move to the Event Comparison card on the
Analysis page, and Event Explorer drops its match section, so it's now a
device-only page. The card names its detection mode, follows the mode
toggle, loads after a run from the page, and hides when the selected
mode has no comparison. `compare_events` now finds its row through
`latest_analysis_row`.

**Removed:** `/events/match`, `EventMatchResult`,
`EventService.match_events`, `get_machine_apnea_hypopnea_times`,
`MATCHABLE_MACHINE_EVENT_TYPES`, `split_by_tolerance_match`,
`HasStartTime` and `getEventMatch`. `convert_machine_events` already
keeps only the matchable types.

**Changes that show up in numbers:**
- Sensitivity goes from 0% to its real value. Across 200 analyzed local
sessions that's 347 of 1,132 device apneas and hypopneas, about 31%.
- `machine_event_count` on the card and in `snore waveform compare` now
counts only apneas and hypopneas, so it drops (1,149 to 1,132 on those
sessions). The card says so, because the summary card on the same page
uses the same label for all device event types.
- False-negative and false-positive totals can shift under one-to-one
matching. On those sessions the totals didn't move (785 and 5,289), and
new counts equal the old matching logic with the time base corrected on
all 205 sessions.
- A missed device hypopnea now reports type `H`. It used to be
`unknown`, because `HypopneaEvent` has no `event_type`.
- `snore waveform compare` prints the matched count, and its Machine
line says "(apneas and hypopneas only)".
- `snore analysis` Missed and Extra lists are now one-to-one and
time-ordered, so they can be longer than before. It still includes RERAs
when the device scored them and `snore waveform compare` doesn't, so the
two can differ on those sessions.
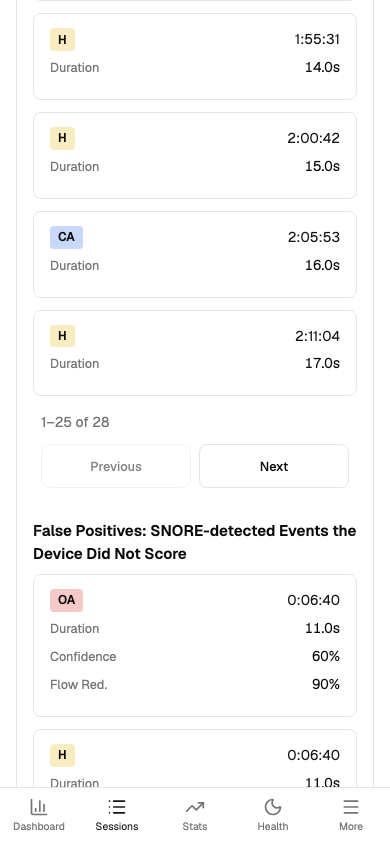
- False-positive and false-negative tables now page at 25 rows through a
shared `TablePager`, which Events by Mode uses too.

These local analysis rows are `STALE_VERSION`, so the exact percentages
will move after re-analysis. The sensitivity number is still SNORE's
experimental detection scored against device events, not a clinical
measurement.

`ui/src/tests/experimentalBoundary.test.ts` closes the gap the REST test
can't see: a default page calling an experimental route. It calls every
`ui/src/api` export against a fake adapter to find the wrappers that hit
experimental operations, then scans all of `ui/src` except `api`,
`tests` and `types`. The operation list lives in
`ui/src/tests/experimentalOperations.json`, and
`EXPERIMENTAL_OPERATIONS` reads the same file, so a new tagged route is
covered on both sides. `cancelAnalysisJob` is the one exception, since
`ImportView` needs it and it reads no metrics.

No migration, re-analysis, re-parse or `recompute-days` is needed.

Stack: #439 → #440 → this PR
Day detail, the Dashboard, Stats and reports show SNORE's own FL and
RERA numbers and its effectiveness and trend judgements next to device
data. `GET /days/{date}` also runs the breath lookup on every load to
produce them. This PR moves that data to separate pages and endpoints,
so a person only sees it by going there. Nothing is deleted, and
analysis still runs on import.

| Default surface | Moved to |
|---|---|
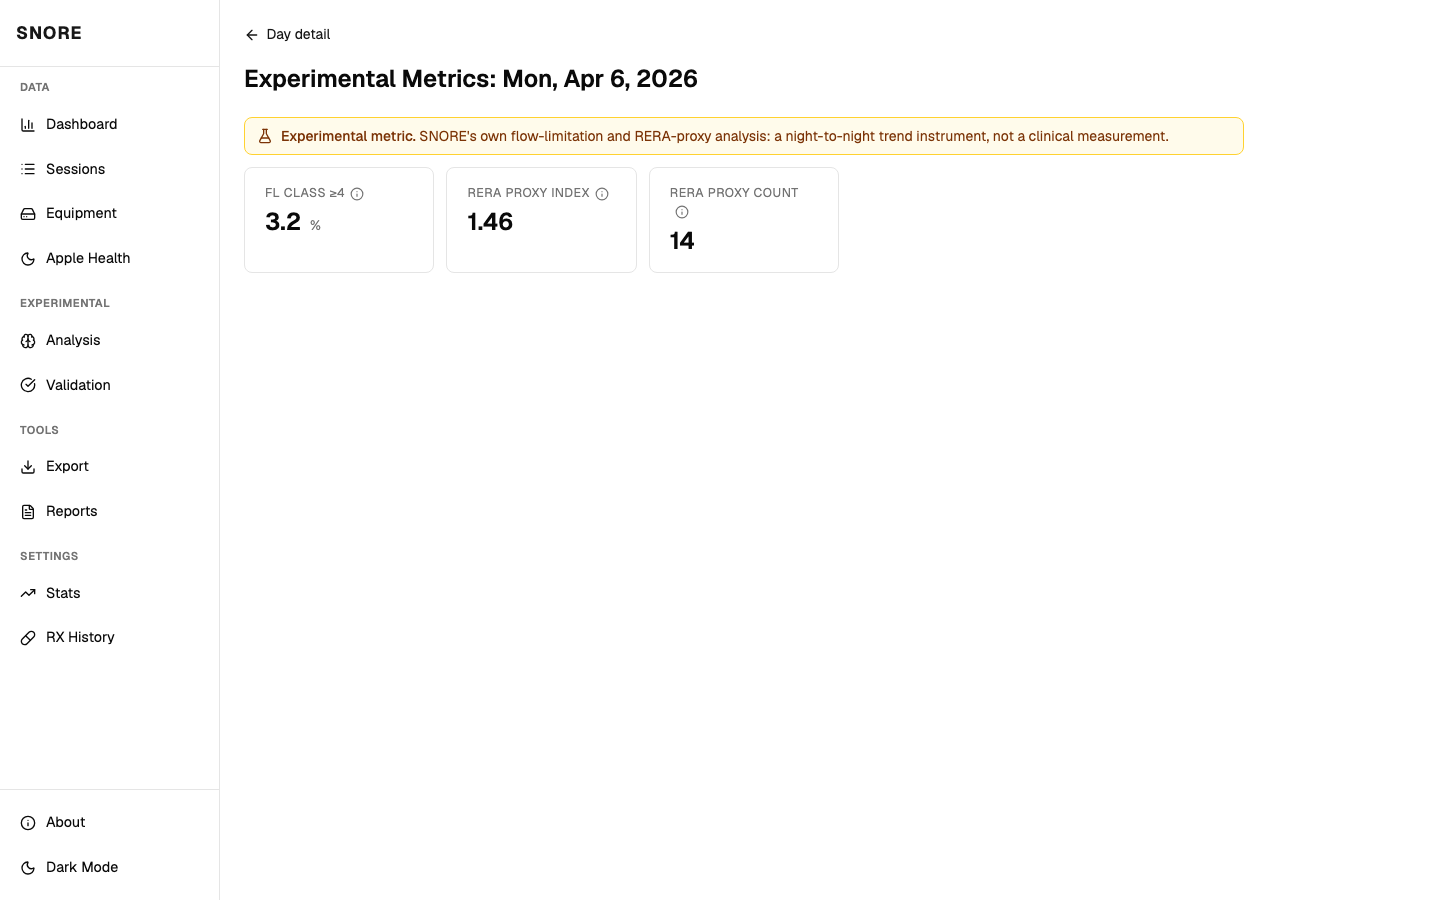
| Day detail and `DayDetail`: `fl_class_ge4_pct`, `rera_index`,
`rera_count` and their reasons | `/days/:date/experimental` and `GET
/days/{date}/experimental` |
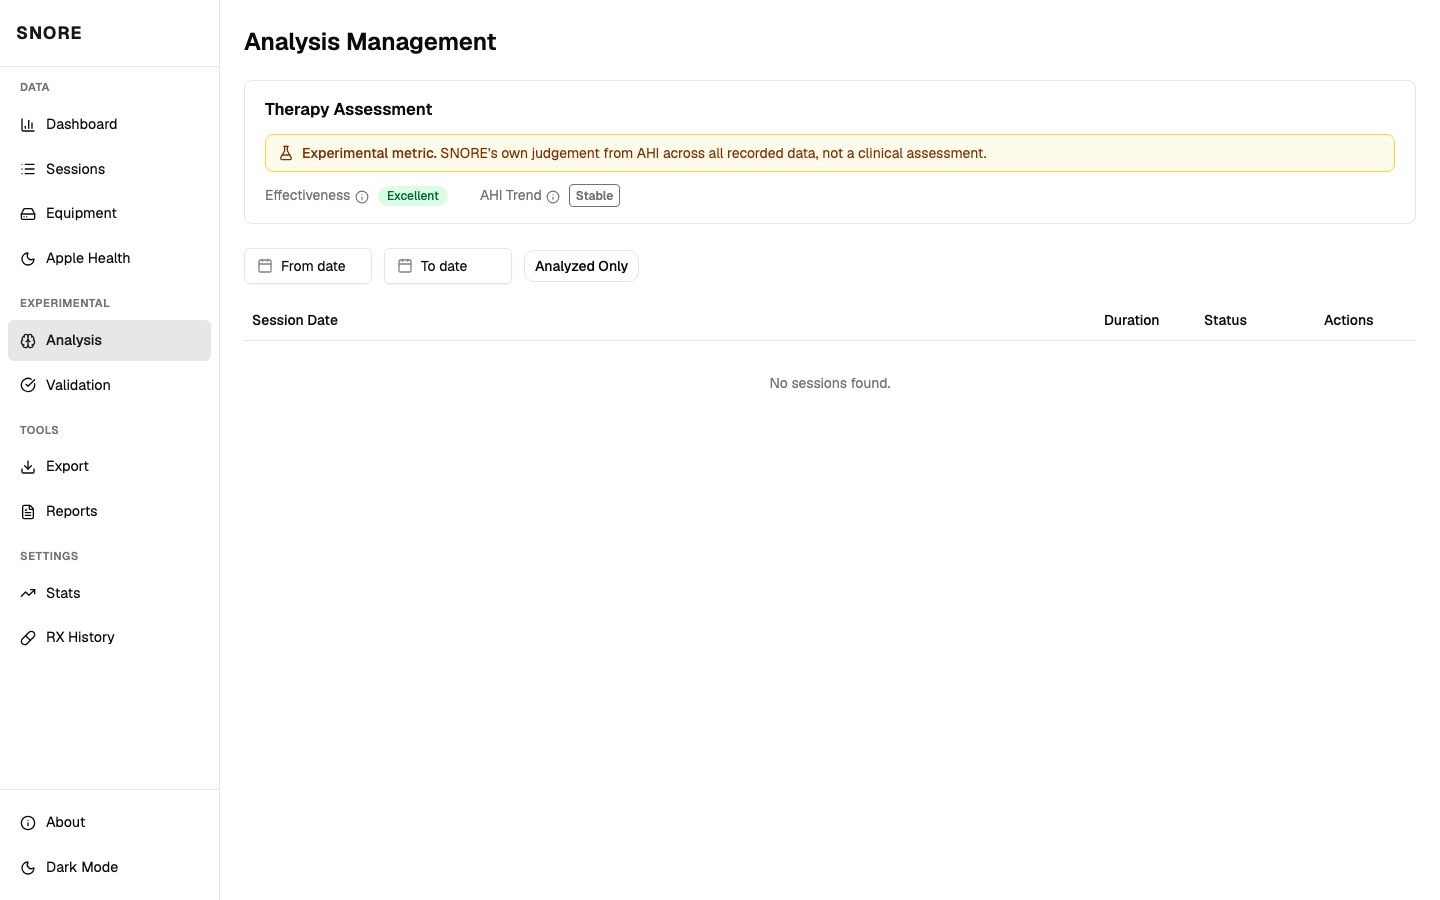
| Dashboard, Stats, `TherapySummary`, report templates: `effectiveness`,
`ahi_trend_direction` | Therapy Assessment card on the Analysis page and
`GET /stats/experimental` |

REST URLs stay put. Operations that return experimental data now carry a
FastAPI `experimental` tag: the analysis and validation routers,
`/events/match`, `/waveforms/compare` and the two new endpoints.
`tests/unit/test_provenance_tags.py` rejects any Experimental field
reachable from an untagged operation, and pins the tagged list in
`EXPERIMENTAL_OPERATIONS` so a route can't be tagged to escape the
check. Tagging is now required on enum and `Literal` response fields
too, so a judgement like `effectiveness` can't go untagged. Plain string
fields still aren't checked. The sidebar group "Analysis" is renamed
"Experimental".

**Changes that show up:**
- `effectiveness` and `ahi_trend_direction` are retagged from Derived to
Experimental, and their API types are now enums. They're SNORE's
judgements, not arithmetic on device data.
- The Therapy Assessment card covers all recorded data and says so. The
old Stats badge followed the Range toggle.
- `GET /days/{date}` no longer touches breath rows, so it answers the
same whether or not analysis has run.
- `snore stats` drops the Effectiveness line and the trend direction in
the chart title.
- `/stats/experimental` takes no `days_limit` and always returns 200. An
empty range gives `{"effectiveness": "unknown", "ahi_trend_direction":
null}`.
- `/stats/summary`, `/stats/periods`, `/stats/trends` and
`/stats/records` return 422 for `days_limit` outside 0 to 36500. Very
large values used to return 500 and negative ones an empty result. No
client sends either.
- `ApneaEvent.event_type` is now tagged Experimental.
- `DayDetailView` reloads when the date changes and drops stale
responses, like the new page.
- A browser tab left open across the deploy shows an undefined
effectiveness badge until reload.

**Left as is:**
- `DayExperimentalMetrics` has no `device_id`, and `DayDetailView` has
no device query, so on a two-device date the page shows the lowest
device id, the same row `GET /days/{date}` picks by default.
- The leak "Assessment" line in `snore stats` (`well controlled` or
`elevated`) is also a SNORE judgement. I left it for now since it wasn't
part of this split.
- Event Explorer still calls `/events/match`. The next PR in the stack
removes that.
- `ImportView` still calls `DELETE /analysis/jobs/{job_id}`, which is
tagged `experimental` with the rest of the analysis router. It only
cancels a job and reads no metrics.

Apple Health stays on the therapy pages, and Records and Rx best/worst
stay default.

No migration, re-analysis, re-parse or `recompute-days` is needed.

Stack: #439 → this PR → #441
wpfleger96
changed the title
b202cc0 to
a566195
Compare

SNORE's default surfaces mixed its own heuristics with device data, so an
agent or a person could not tell what the machine reported. The validation doc
does not support that placement: the RERA proxy runs near 1.6x chance
precision and about 5% sensitivity against device RE events.

Experimental data now lives in experimental_* MCP tools, tagged REST
operations and separate UI pages, so calling or opening one is the opt-in.
Default paths no longer read breath rows, so they answer the same with or
without analysis. Tests enforce the boundary on all three surfaces.

Event matching merges into the Analysis page because /events/match compared
relative times with absolute ones and never matched anything.

Breaking for MCP clients: get_breath_table and find_windows are renamed, and
nightly, event and epoch fields moved. STR leak values are now stored in
L/min, so stored leak_percentile_70 stays in L/s until import --force.
Tidal volume reads in mL on every surface, whichever parser stored it.
a566195 to
9e7f758
Compare

ScreenshotsAll of these use a mocked API, so the numbers are illustrative and not real results. Event Comparison cardThe card on the Analysis page shows Matched and Sensitivity and names its detection mode. The tables page at 25 rows with
Event Comparison on mobileThe pager uses the shared
Event Comparison failureA failed comparison request now shows an error with a retry. Only a 404 hides the card.
Therapy Assessment
Experimental day metricsFL and RERA proxy values moved off Day detail to
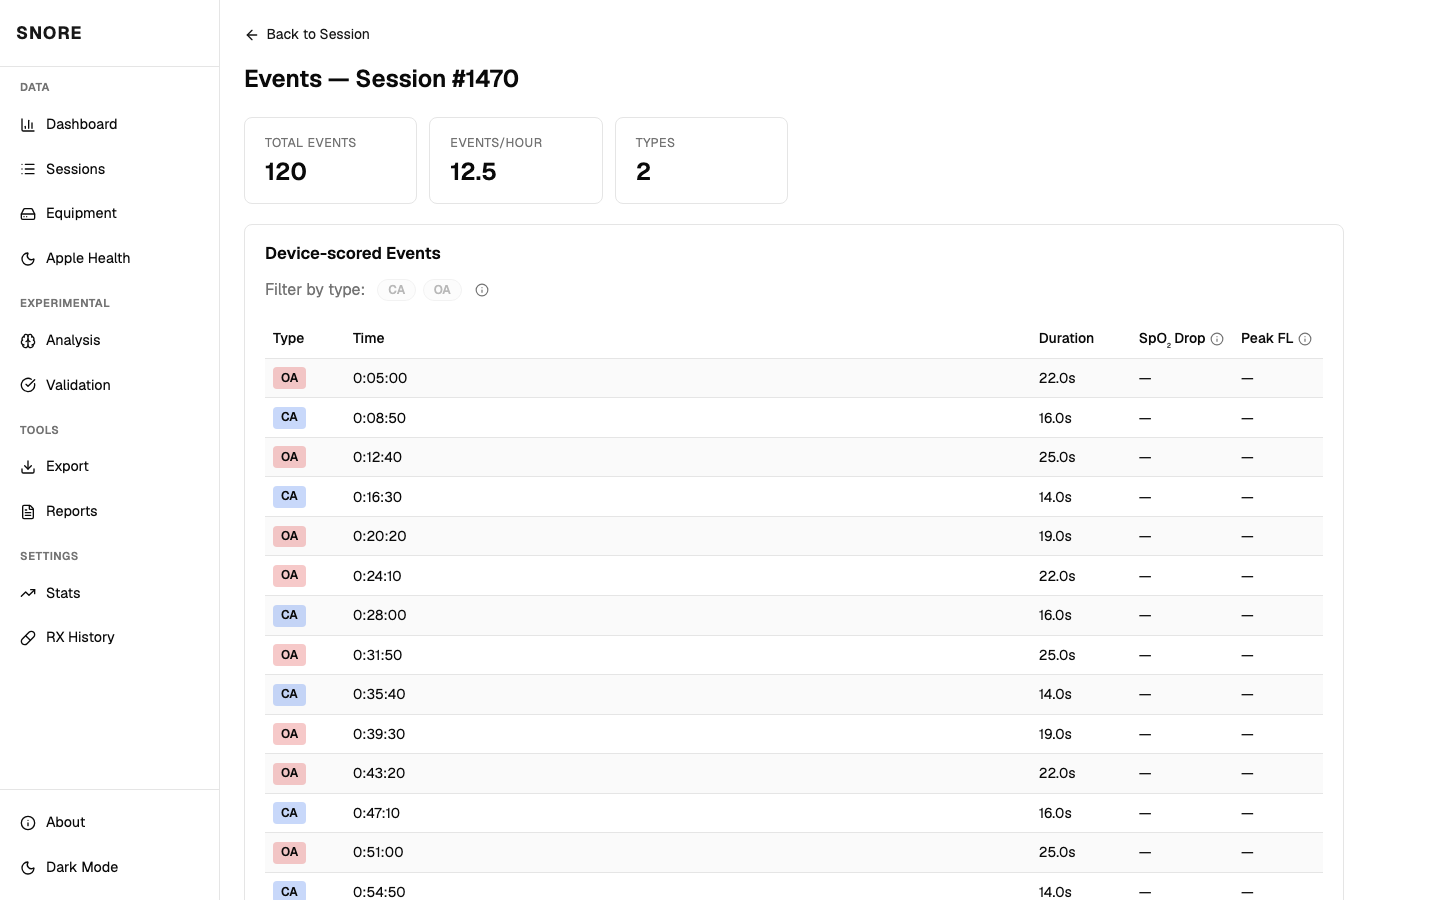
Event ExplorerThe match section is gone, so this is a device-only page.
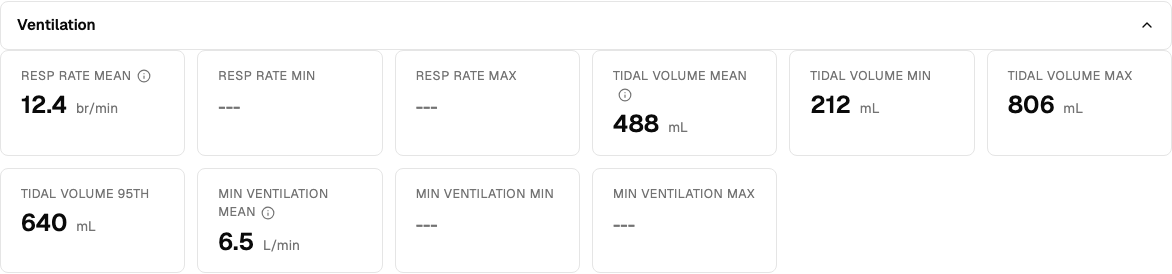
Tidal volumeSession detail shows mL for every import source. The values come from the API in mL, so the page no longer multiplies by 1000.
|


SNORE's default surfaces mix its own heuristics with device data. A default
get_nightly_summarycall returns 11 experimental fields, and the server instructions call computed metrics primary and raw device data an escape hatch. Day detail, the Dashboard, Stats and reports show the same FL and RERA numbers, plus SNORE's effectiveness and trend judgements, next to what the machine reported.docs/fl-rera-validation.mddoesn't support that placement: the RERA proxy runs at about 1.6x chance precision and about 5% sensitivity against device RE events.This PR moves that data to separately named MCP tools, tagged REST operations and separate UI pages, so an agent or a person only gets it by asking. Nothing is deleted, no detection algorithm changes, and analysis still runs on import. The line is OSCAR's: device data plus the kind of arithmetic OSCAR does stays default, and SNORE's heuristics and invented measures move. It controls what is shown, not what is computed, and it is opt-in by naming, not access control.
get_nightly_summaryexperimental_get_nightly_metrics:rera_index,rdi, FL fields,rera_proxy_*,periodic_breathing_pct, and segmented Ti and I:E assegmented_ti_median_sandsegmented_ie_ratioget_eventsexperimental_get_event_context: MV slope, stability index, flow-derived MVcompare_epochsexperimental_compare_epochs: breath distributions, flow classes,rera_proxy_countget_breath_table,find_windowsexperimental_get_breath_table,experimental_find_windowsDayDetail:fl_class_ge4_pct,rera_index,rera_countand their reasons/days/:date/experimentalandGET /days/{date}/experimentalTherapySummary, report templates:effectiveness,ahi_trend_directionGET /stats/experimentalOn MCP, a parameter would have left one tool with two contracts and a server flag would hide data with no way to ask, so calling an
experimental_*tool is the opt-in. REST URLs stay put, and operations that return experimental data carry a FastAPIexperimentaltag. UI routes stay put too, and the sidebar group "Analysis" is renamed "Experimental".Default paths also stop reading breath rows, so they answer the same whether or not analysis has run. That needed more than hiding fields:
get_nightly_summary,compare_epochs,GET /days/{date}and the leak stat all depended on analysis before.get_nightly_summarygains device-scoredobstructive_apneas,central_apneas,hypopneasandreras, because removing the proxy would otherwise leave it with no RERA figure.Tests hold the boundary on each surface:
tests/unit/test_mcp_provenance.py: every tool is inDEFAULT_TOOLSor prefixed, and no default model carries an Experimental field at any depth.tests/integration/test_mcp_device_waveform_aggregates.py: every default tool runs with SQL capture to prove it reads no breath rows.tests/unit/test_provenance_tags.py: no untagged REST operation can reach an Experimental field. Tagging is required on numeric, boolean, enum andLiteralfields, and plain strings aren't checked.ui/src/tests/experimentalBoundary.test.ts: no default page may call an experimental wrapper, import an experimental view or component, or reach an experimental path through the raw API client. It finds the wrappers by calling everyui/src/apiexport against a fake adapter, then scans all ofui/srcexceptapi,testsandtypes.cancelAnalysisJobis the one exception, sinceImportViewneeds it and it reads no metrics.ui/src/tests/experimentalOperations.jsonis the single tagged-operation list, read by both the REST and UI tests, so a route can't be tagged to escape the check.Event matching
GET /sessions/{id}/events/matchreported 0 matched. It added the storedtimestamp_startto each SNORE event's relative time and compared the result with absolute device times, buttimestamp_startis0.0on stored analysis results, so nothing lined up. On every analyzed session I checked locally it matched nothing, which made every device event a false negative and every SNORE event a false positive./waveforms/comparehad the right time base but used any-match false negatives, counted every device event type, had no matched count, and hardcoded the 5 s tolerance.This PR deletes
/events/matchand rewritescompare_eventsonmatch_events_by_start_timewithEVENT_MATCH_TOLERANCE_SECONDS, pooling apneas and hypopneas on both sides so each event is in at most one pair. RERAs join the pool only when the device scored some, the same rulevalidate_against_machine_eventsuses, so unmatched SNORE RERAs aren't counted against ground truth that doesn't exist. The result gainsmatched_eventsandfalse_positives_rera, and Event Explorer becomes a device-only page. The Event Comparison card shows Matched and Sensitivity, names its detection mode, follows the mode toggle without flicker, keeps each mode's result until the next run, and loads after a run from the page. It hides only when the selected mode has no comparison (404), and any other failure shows an error with a retry.Removed:
/events/match,EventMatchResult,EventService.match_events,get_machine_apnea_hypopnea_times,MATCHABLE_MACHINE_EVENT_TYPES,split_by_tolerance_match,HasStartTimeandgetEventMatch.Changes that show up in numbers
MCP:
leak_above_24_pctis now the percent of leak samples at or above 24 L/min, which is OSCAR's time over the default redline. It used to be a percent of segmented breaths, and it was tagged Experimental.ti_median_sandie_ratio_medianinget_nightly_summarynow come from the device STR values, so they're null on APAP nights (0 of 529 AirSense sessions have them). Device Ti can be coarse (1.0 or 2.0 s on my AirCurve), because that's how the device reports it. The STR header gives I:E a physical dimension of%, its exact definition is unconfirmed, and it isn't comparable tosegmented_ie_ratio. The field descriptions say both.compare_epochscovers every enabled session instead of only analyzed ones, dropsmetrics, and reportsn_samplesand a true calendarn_nights. The old night count counted sessions.no_data_in_rangeon both epoch tools, andexperimental_compare_epochsreturns it at the top level for an owneddevice_idwith no sessions.leak_above_24_pctwith the new reasonchannel_corrupt.get_eventsreturns a night with a corrupt pressure, leak or MV blob, with null context for the affected channel. Corruptflandsnoreblobs still reportchannel_absent.get_eventsfillsspo2_drop_pctandpeak_flow_limitationfrom the event table when present. No parser fills either yet.Stored and API values:
leak_percentile_70on every ResMed session, andleak_median,leak_95thandleak_maxon sessions with no leak waveform.tv_mean_mland the session page multiplied OSCAR values by 1000,snore statsandsnore session showprinted litres as mL (about 500 mL showed as 1 mL), andavg_tidal_volumeaveraged the two units together. All of them now go throughtidal_volume_ml, soSessionDetail.statistics.tidal_volume_*andavg_tidal_volumeare mL for every import source. TheStatisticscolumns themselves keep their mixed units.db scrub-democonverts OSCAR-sourced tidal volume to litres when it copies statistics, because it rewritesimport_sourcetodemoand would otherwise lose the unit.effectiveness,ahi_trend_direction, MV slope and MV stability are Experimental, andeffectivenessandahi_trend_directionare enums in the API./stats/experimentaltakes nodays_limitand always returns 200. An empty range gives{"effectiveness": "unknown", "ahi_trend_direction": null}./stats/summary,/stats/periods,/stats/trendsand/stats/recordsreturn 422 fordays_limitoutside 0 to 36500. Very large values used to return 500 and negative ones an empty result. No client sends either.device_idon/daysand/days/{date}and the session id on/sessions/{id}/waveforms*return 422 above2**63 - 1, which SQLite can't bind.Event comparison:
machine_event_counton the card and insnore waveform comparenow counts only apneas and hypopneas, plus RERAs when the device scored some, so it can drop on a session with other device event types. It doesn't on those 172 sessions, and none of them have device RERAs. The card and the CLI both say so.H. It used to beunknown.snore analysisMissed and Extra lists are one-to-one and time-ordered, so they can be longer than before.snore analysisandsnore waveform comparenow apply the same RERA rule, so they agree.UI and CLI:
snore statsdrops the Effectiveness line and the trend direction in the chart title.DayDetailViewreloads when the date changes and drops stale responses.PaginationBar, driven by a sharedusePagedRows, which Events by Mode and Event Explorer use too. The pager reads "1–25 of 30".Breaking for clients
ie_ratio, which is nowie_ratio_medianinget_nightly_summary(the companion staysie_ratio_reason).docs://schemas,compare_epochs_responseholds the default schema andexperimental_compare_epochs_responseholds the experimental one./waveforms/comparereturnsmatched_eventsandfalse_positives_rera, and/events/matchis gone.SessionDetail.statistics.tidal_volume_*is mL instead of the stored value.pageis capped at 1,000,000 on every paged tool, includingexperimental_get_breath_table, and non-finite thresholds,min_duration,context_secondsandflattening_thresholdare rejected.Rollout
No migration, re-analysis or
recompute-daysis needed. Storedleak_percentile_70values stay in L/s until a session is re-parsed withimport --force. So do storedleak_median,leak_95thandleak_maxon sessions with no leak waveform, along with the Day rows built from them, and a new no-waveform session can average with an old one on the same Day. Don't runimport --forceon a multi-device profile until #449 is fixed.Left as is
DayExperimentalMetricshas nodevice_id, andDayDetailViewhas no device query, so on a two-device date the page shows the lowest device id, the same rowGET /days/{date}picks by default.snore stats(well controlledorelevated) is also a SNORE judgement. It wasn't part of this split.Related: #332 (its plan to expose
csr_pctisn't adopted, the STR value is unusable on these devices), #408 (min_usage_hourstouches the tools split here), #405 and #407 (RERA proxy caveats), #431 (rdiinherits the recount gap), #450 (the 1970analysis_resultstimestamps).