Symbol autocompletion, function and symbol navigation. Supports C, Kconfig, defconfig, .config and device tree files. Plus some automation to match device tree compatibles and open their respective driver or documentation files.
The extension works on Linux systems, also tested on WSL, and uses some packages for its correct operation. Before use you must install the following dependencies on your system:
- bash
- universal-ctags
An important detail is to install universal-ctags and not exuberant-ctags to have support to index Kconfig and device tree files.
A new Kconfig Engine parser is in testing phase. This does not use ctags and it has a totally different behavior.
To use new Kconfig Engine add the following to your settings.json:
"kerneldev.experimental.newKconfigEngine": trueAlso to have the correct index to the target architecture you must add the following to your settings.json:
    "kconfig.env": {
        "SRCARCH": "x86" // or arm, arm64, mips, etc...
    }
⚠️ To these settings take effect you must reload the VS Code window.
This extension automatically integrates to Devicetree LSP. This extension contributes the following settings.
    "defaultIncludePaths": ["${workspaceFolder}/include"],
    "defaultBindingType": "DevicetreeOrg",
By default the paths to the defaultDeviceOrgBindingsMetaSchema and defaultDeviceOrgTreeBindings are not set.
Devicetree LSP allow for the above to be
overridden or set by adding these in settings.json. See Devicetree LSP documentation for more.
Now the extension has built-in tools to be able to easily start a debug session with KGDB. An example for launch configuration for attach to KGDB:
    {
        "type": "cppdbg",
        "name": "Kernel KDGB",
        "request": "launch",
        "program": "/tmp/kernel/rpi/artifacts/bcm2711-rpi-4b/vmlinux",
        "cwd": "${workspaceFolder}",
        "symbolLoadInfo": {
            "loadAll": false,
            "exceptionList": ""
        },
        "MIMode": "gdb",
        "miDebuggerPath": "/usr/bin/gdb-multiarch",
        "setupCommands": [
            {
                "description": "Enable pretty-printing for gdb",
                "text": "-enable-pretty-printing",
                "ignoreFailures": true
            },
            {
                "text": "set arch aarch64"
            },
            {
                "text": "target remote localhost:${config:kerneldev.kgdb_port}"
            },
        ],
        "preLaunchTask": "${command:embeddedLinuxDev.breakKernel}"
    },
There are some properties that need attention:
program- It has to be the exactly Kernel
vmlinuxfile you are trying to attach the debugger to;
- It has to be the exactly Kernel
miDebuggerPath- You need the
gdb-multiarchinstalled on your distro;
- You need the
setupCommands- In the
"text": "set arch aarch64"you must put the architecture of the target you want to attach the debugger;
- In the
preLaunchTask- Do not remove the command
${command:embeddedLinuxDev.breakKernel}. If you need to add a custom task for your use case, don't forget to add the command call in the tasks pipeline as the last task to be executed. Is this command that initializes theagent-proxythat will share what is fromgdband what is from the session console;
- Do not remove the command
To break the kernel in order to initialize the debug session and correctly send the required breakpoints, the embeddedLinuxDev.breakKernel command needs some settings. These are necessary:
    "kerneldev.kgdb_port": "6061",
    "kerneldev.serial_port": "6060",
These ports will be used by agent-proxy to create telnet sessions to distribute what comes from gdb and what comes from the normal Linux console.
The recommended way to put the Linux Kernel in debug mode is by using Linux Magic System Request Key Hacks:
"kerneldev.breakBySysrq": "break"But if you want to execute the break via ssh, use:
⚠️ Executing the break viasshis especially useful when your serial device does not supportBREAK
    "kerneldev.breakBySysrq": "ssh",
    "kerneldev.ssh_login": "seadog",
    "kerneldev.ssh_psswd": "seadog",
    "kerneldev.ssh_ip": "192.168.0.53",
And if you want to execute the break via serial, use:
    "kerneldev.breakBySysrq": "serial",
    "kerneldev.serial_port": "6060",
⚠️ For this mode work you need to leave a previous serial connection logged in.
⚠️ Executing the break viaserialis especially useful when your serial device supportsBREAKand you want a more direct way to send the break command without the overhead ofssh.
A debugger adapter for crash utility https://github.com/crash-utility/crash was added. This new debugger adapter has type crash, example configuration for the launch.json:
    {
        "type": "crash",
        "request": "launch",
        "name": "Run Crash Utility",
        "crash": "/tmp/crash/crash",
        "vmlinux": "/tmp/kernel/rpi/artifacts/bcm2711-rpi-4b/vmlinux",
        "vmcore": "/media/rootfs/var/log/vmcore"
    }
Description of properties:
"crash": {
    "type": "string",
    "description": "Absolute path to the crash utility binary"
},
"vmlinux": {
    "type": "string",
    "description": "Absolute path to the Kernel vmlinux with debug symbols"
},
"vmcore": {
    "type": "string",
    "description": "Absolute path to the kdump vmcore"
}All features of the extension can be accessed by clicking commands through the activity bar:
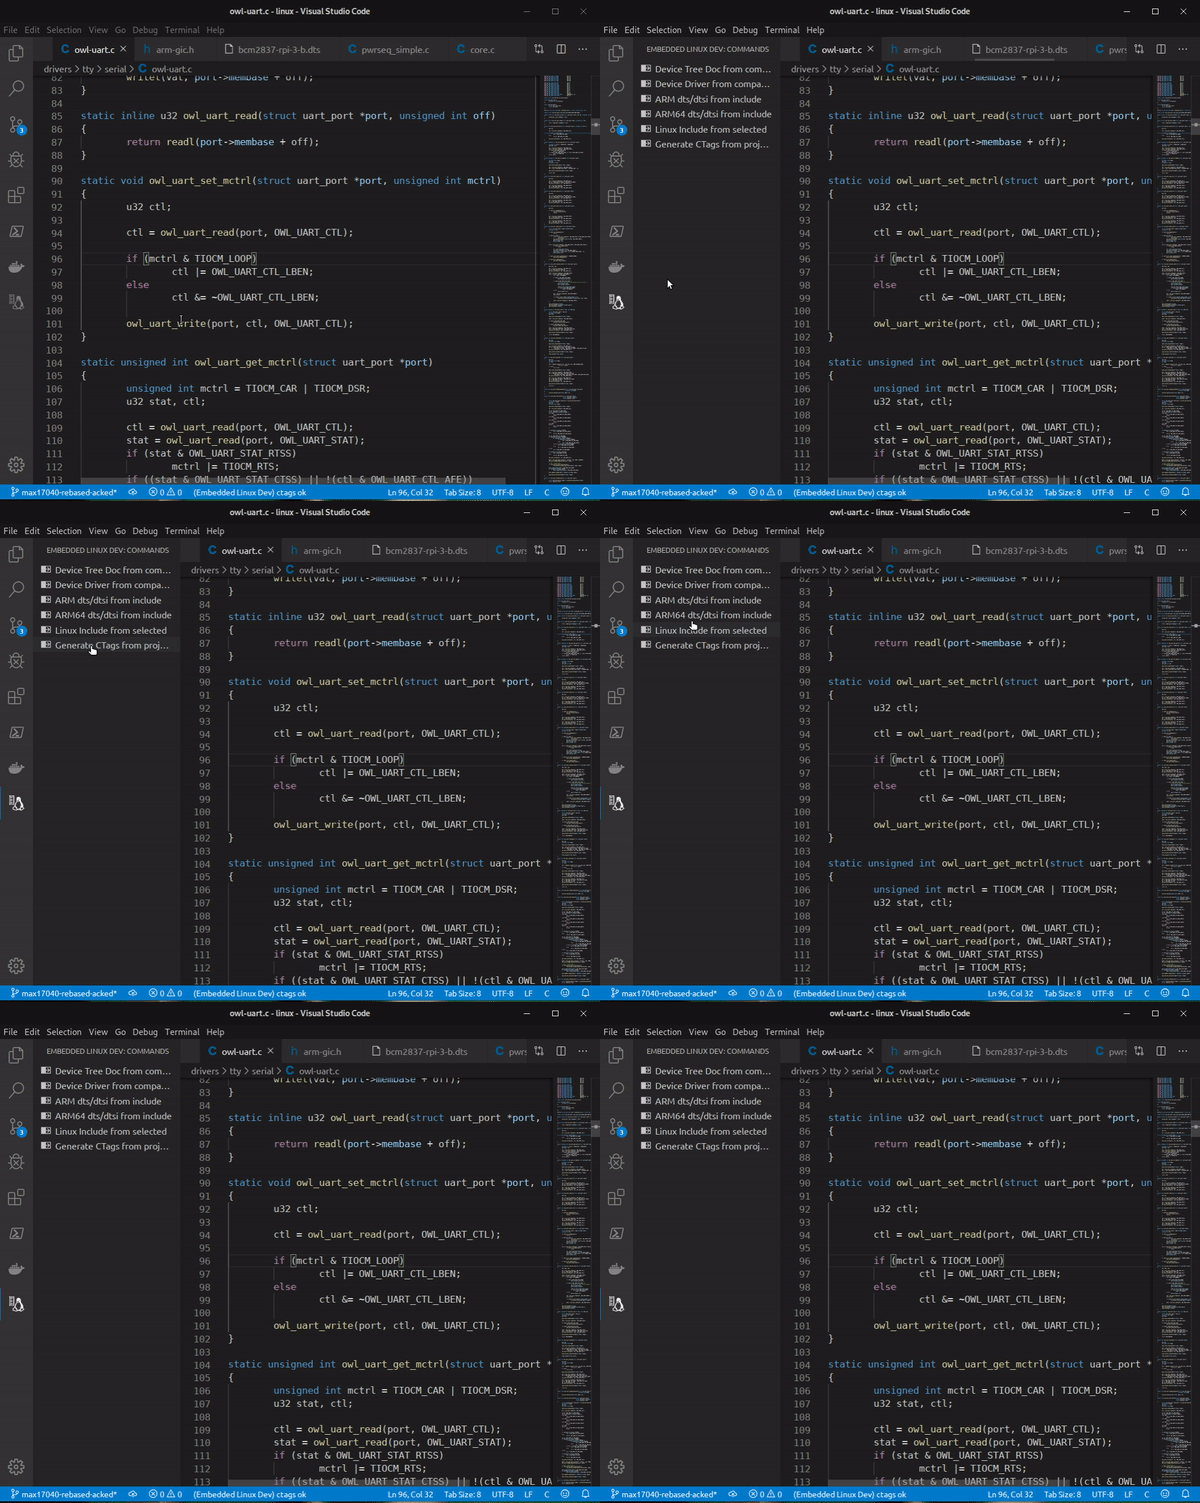
In the next topics, I will describe each of the extension features.
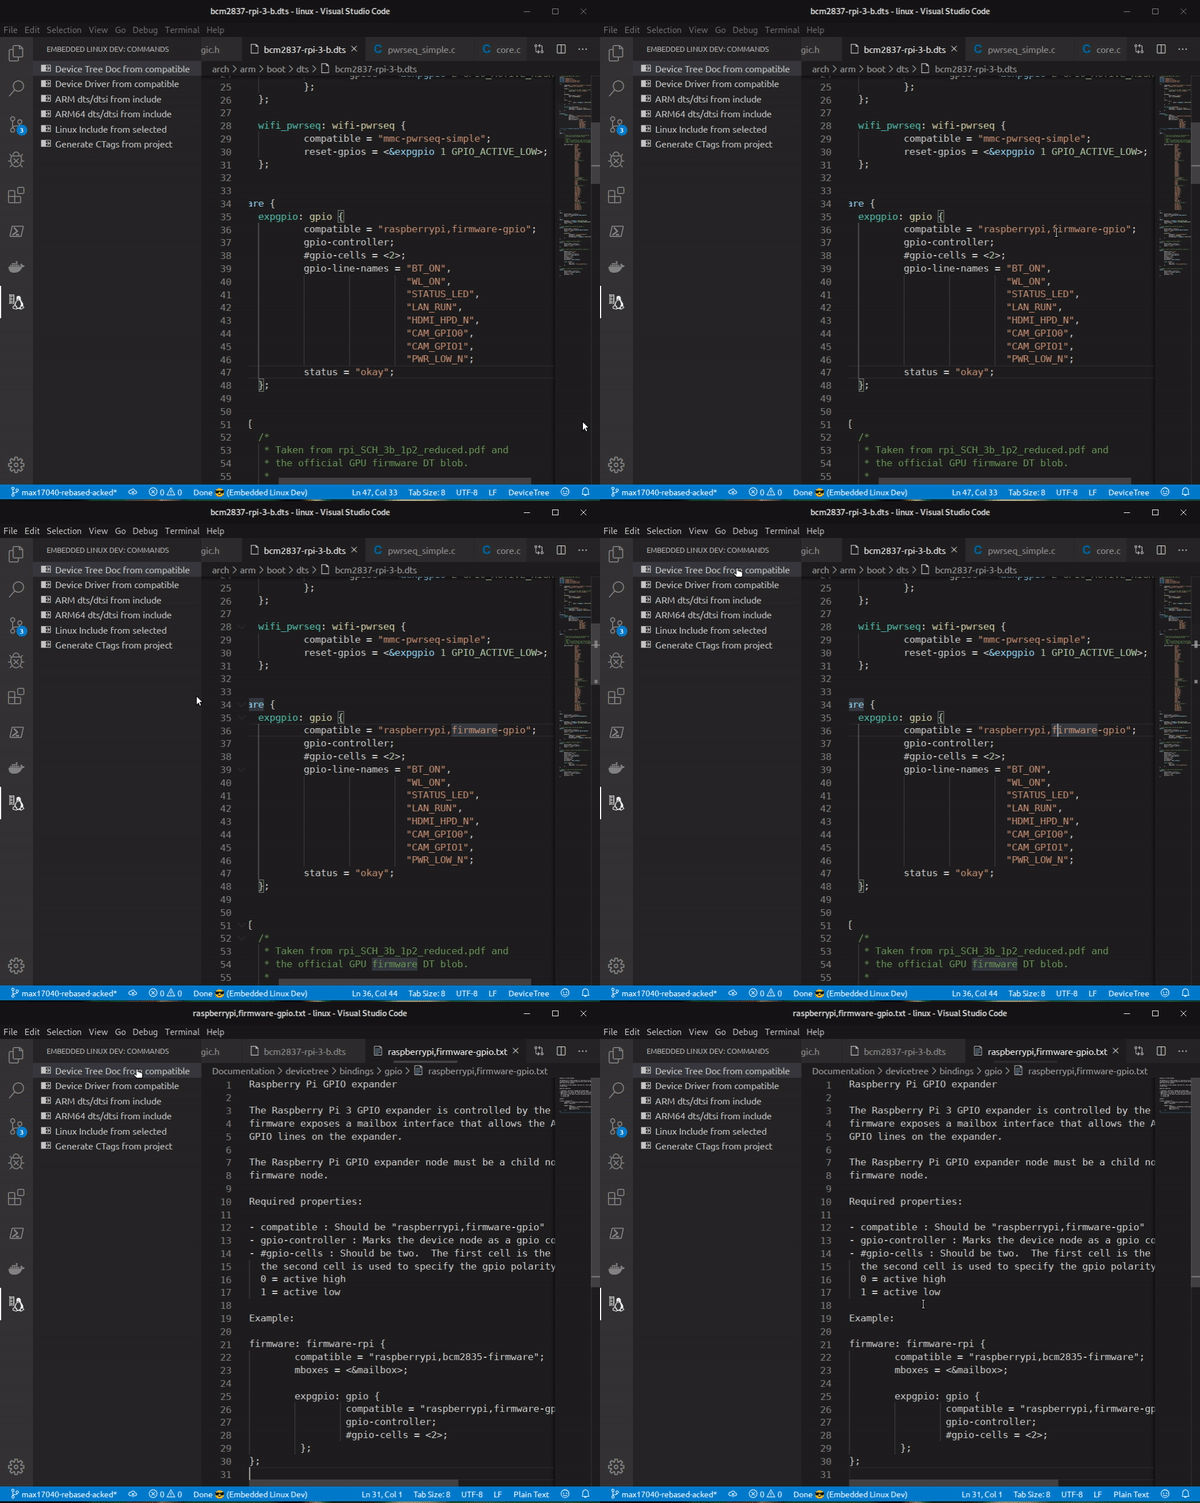
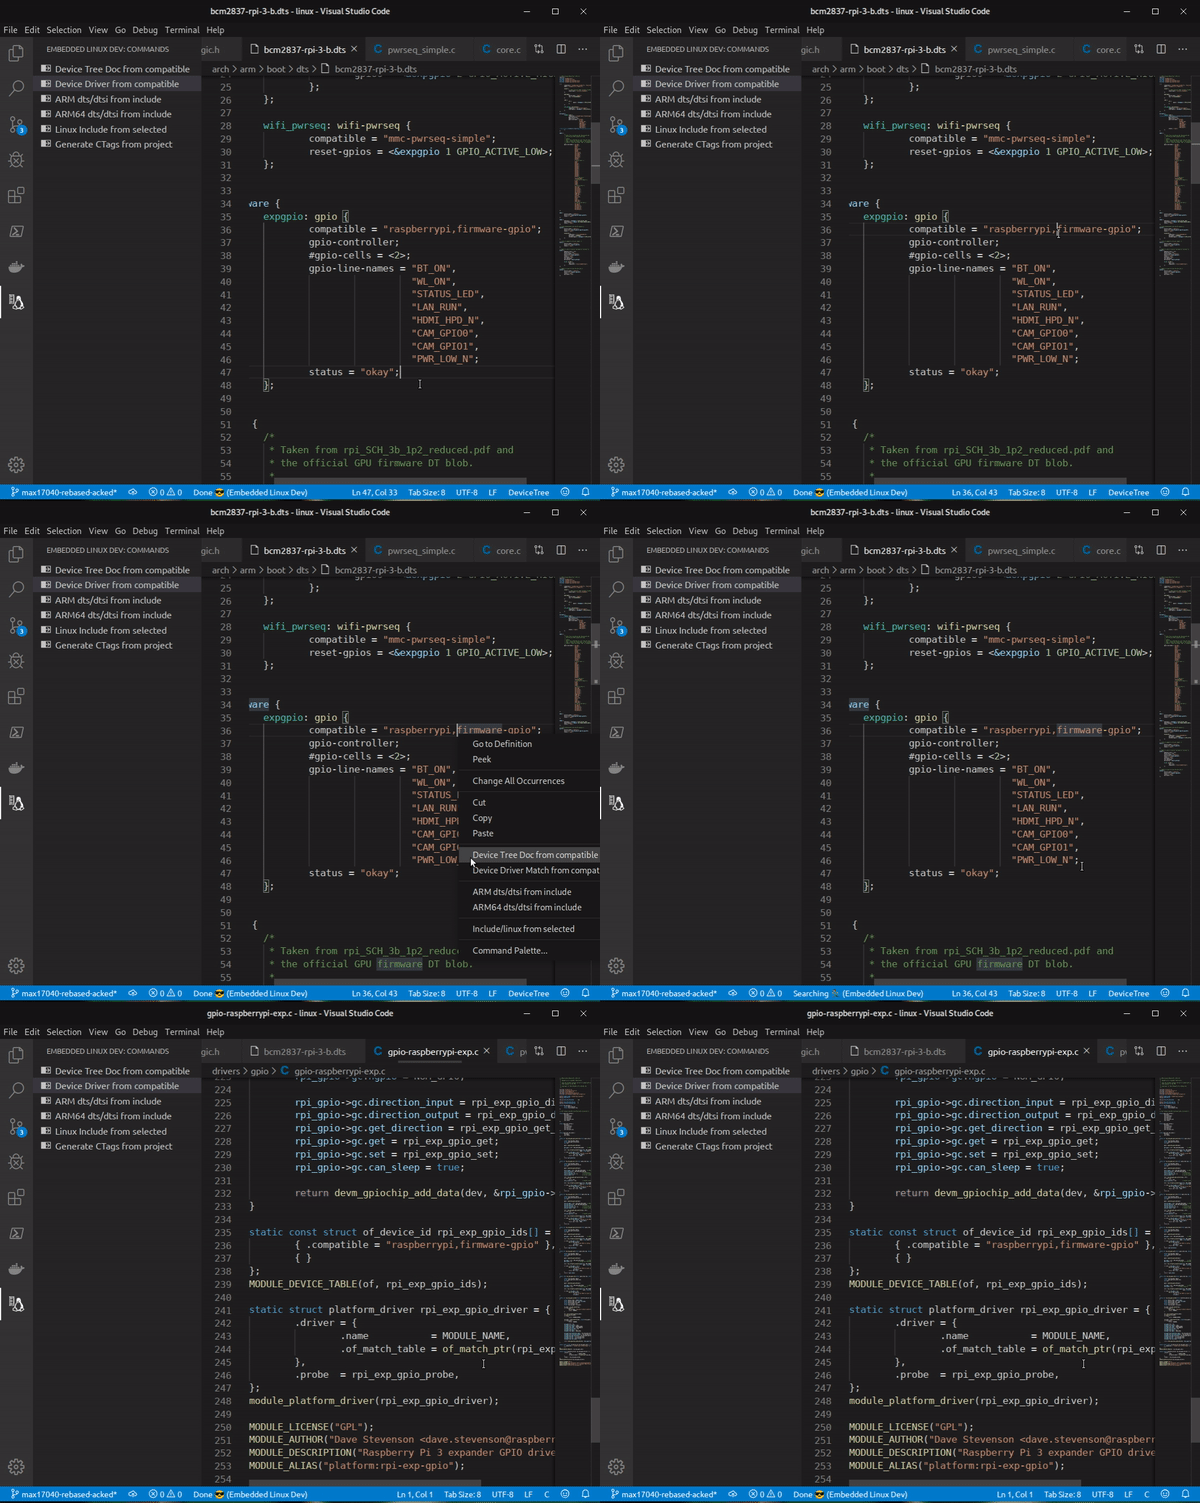
In a device-tree file, ".dts" or ".dtsi", or in a device driver file ".c", mouse click on a "compatible" string and select the command. VS Code will open the corresponding documentation file for the compatible:
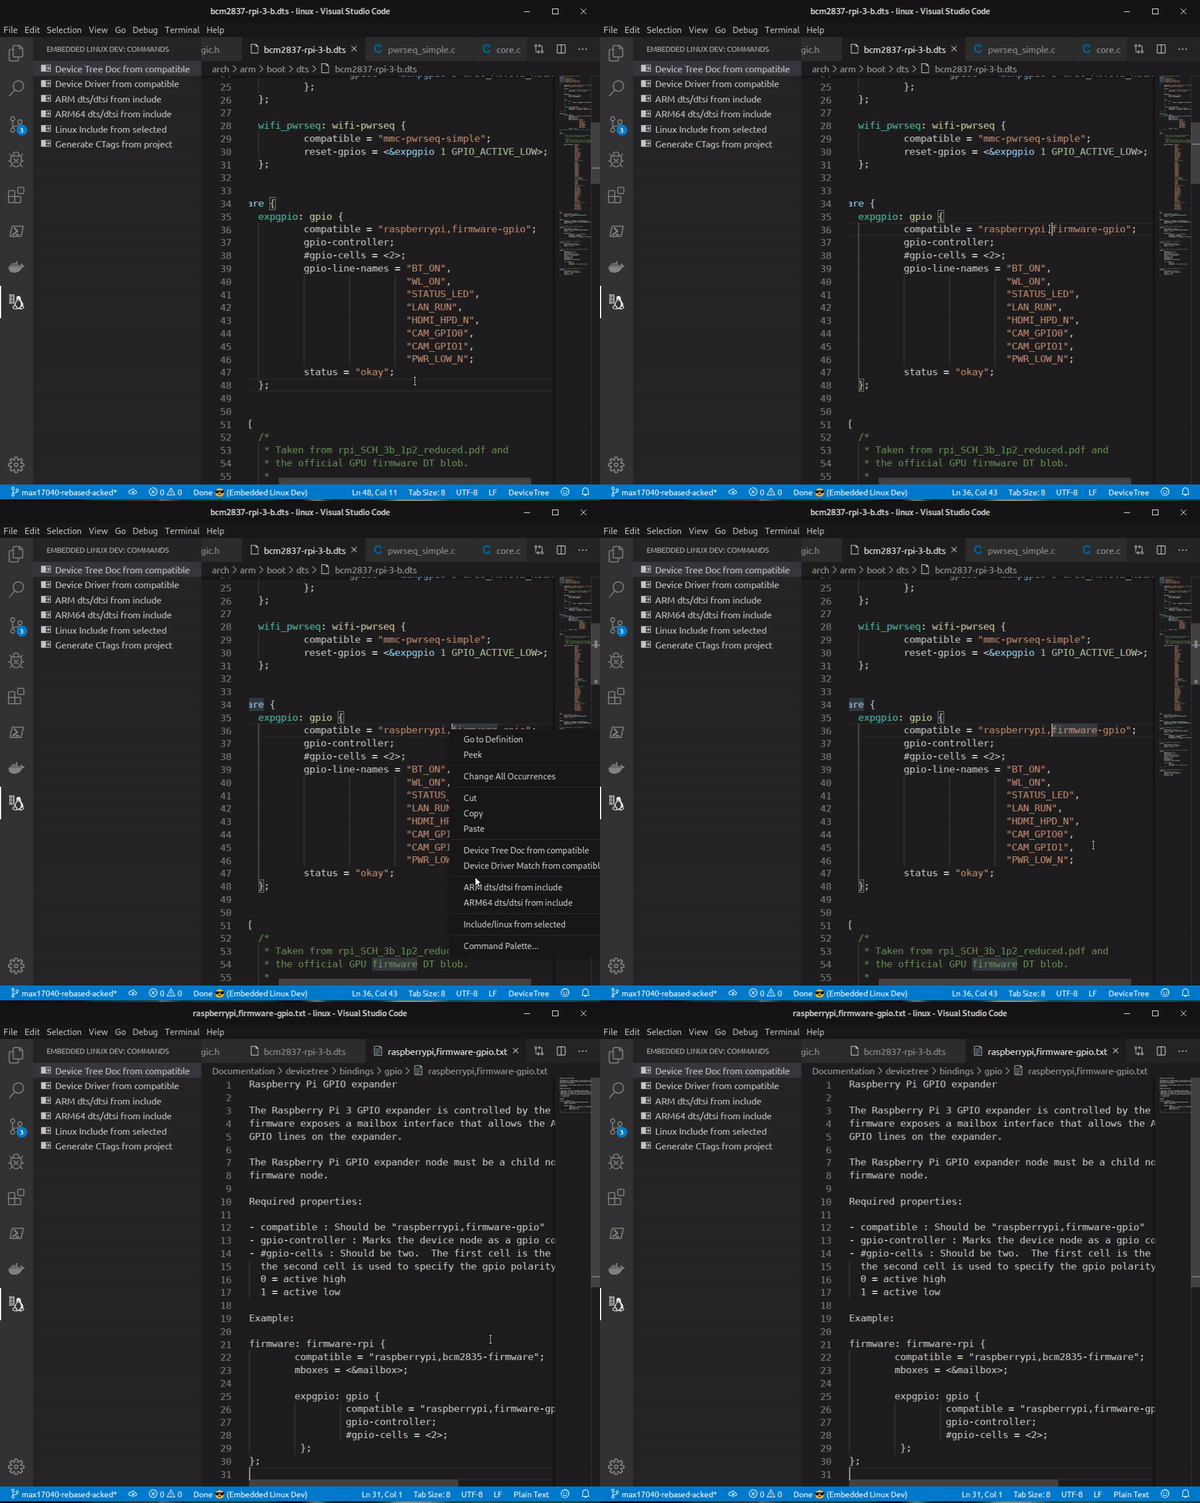
This functionality can also be selected from the right click context menu:
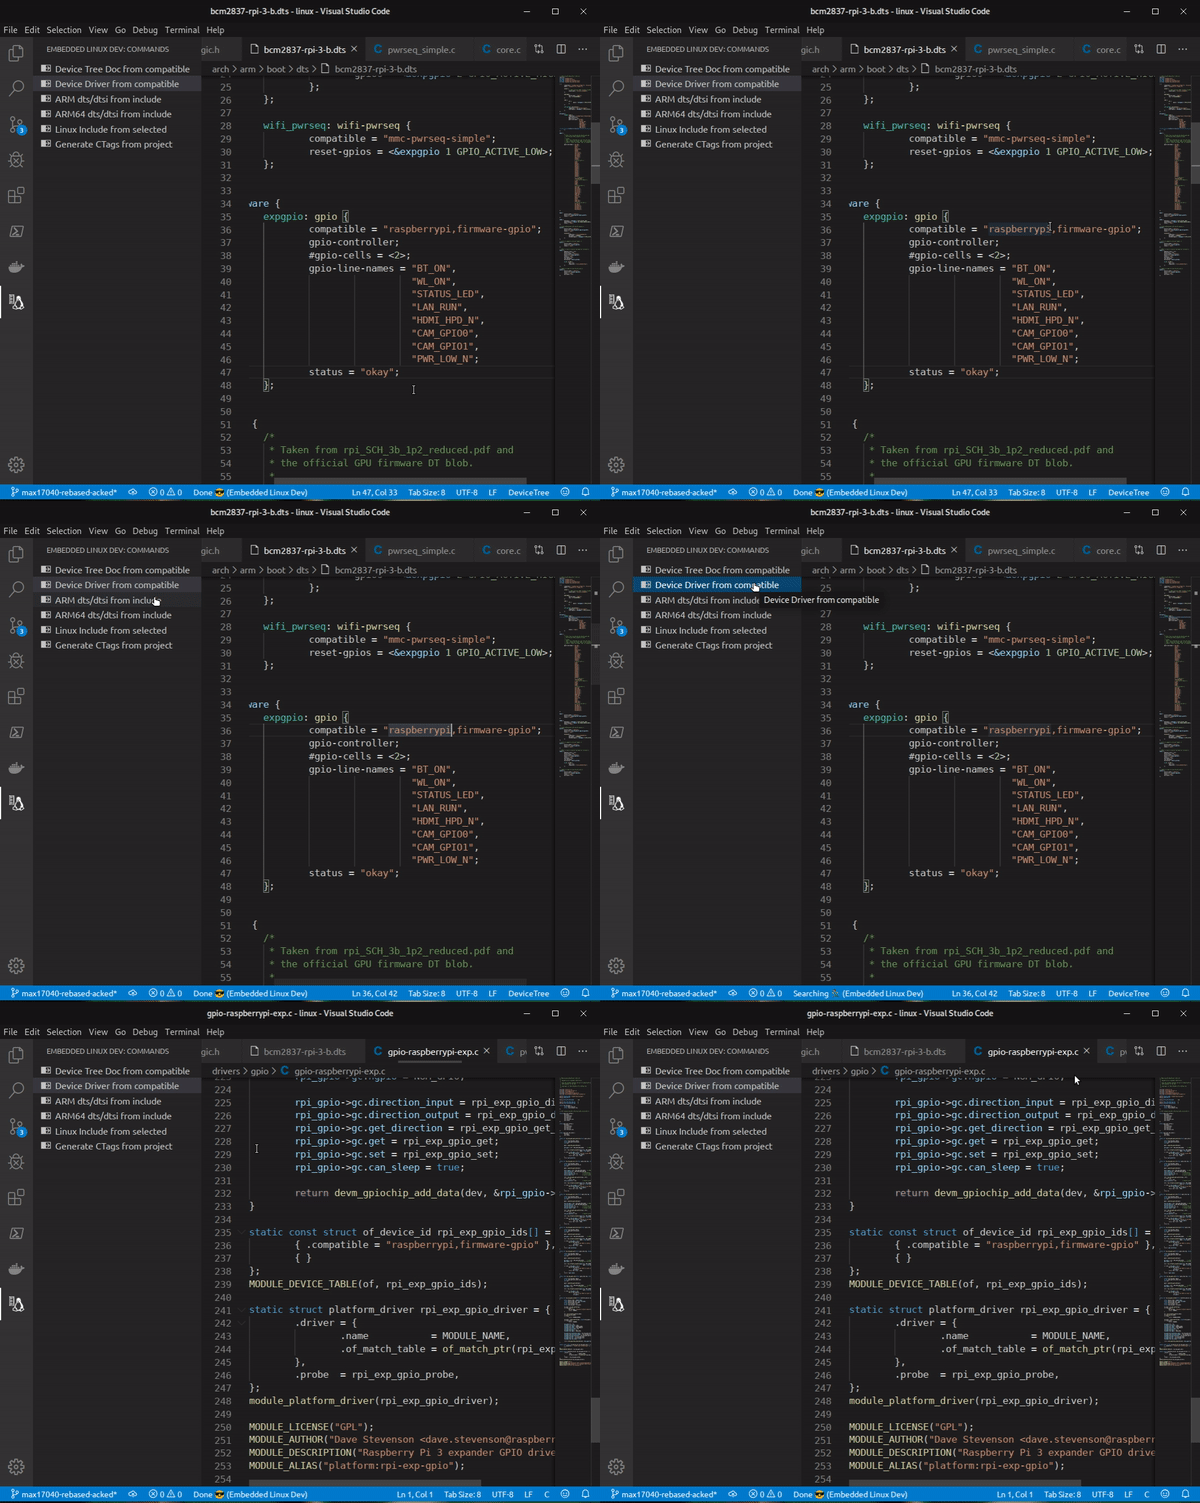
In a device-tree file, ".dts" or ".dtsi", mouse click on a "compatible" string and select the command. VS Code will match and open the code file, “.c”, from the driver that implements compatible:
This functionality can also be selected from the right click context menu:
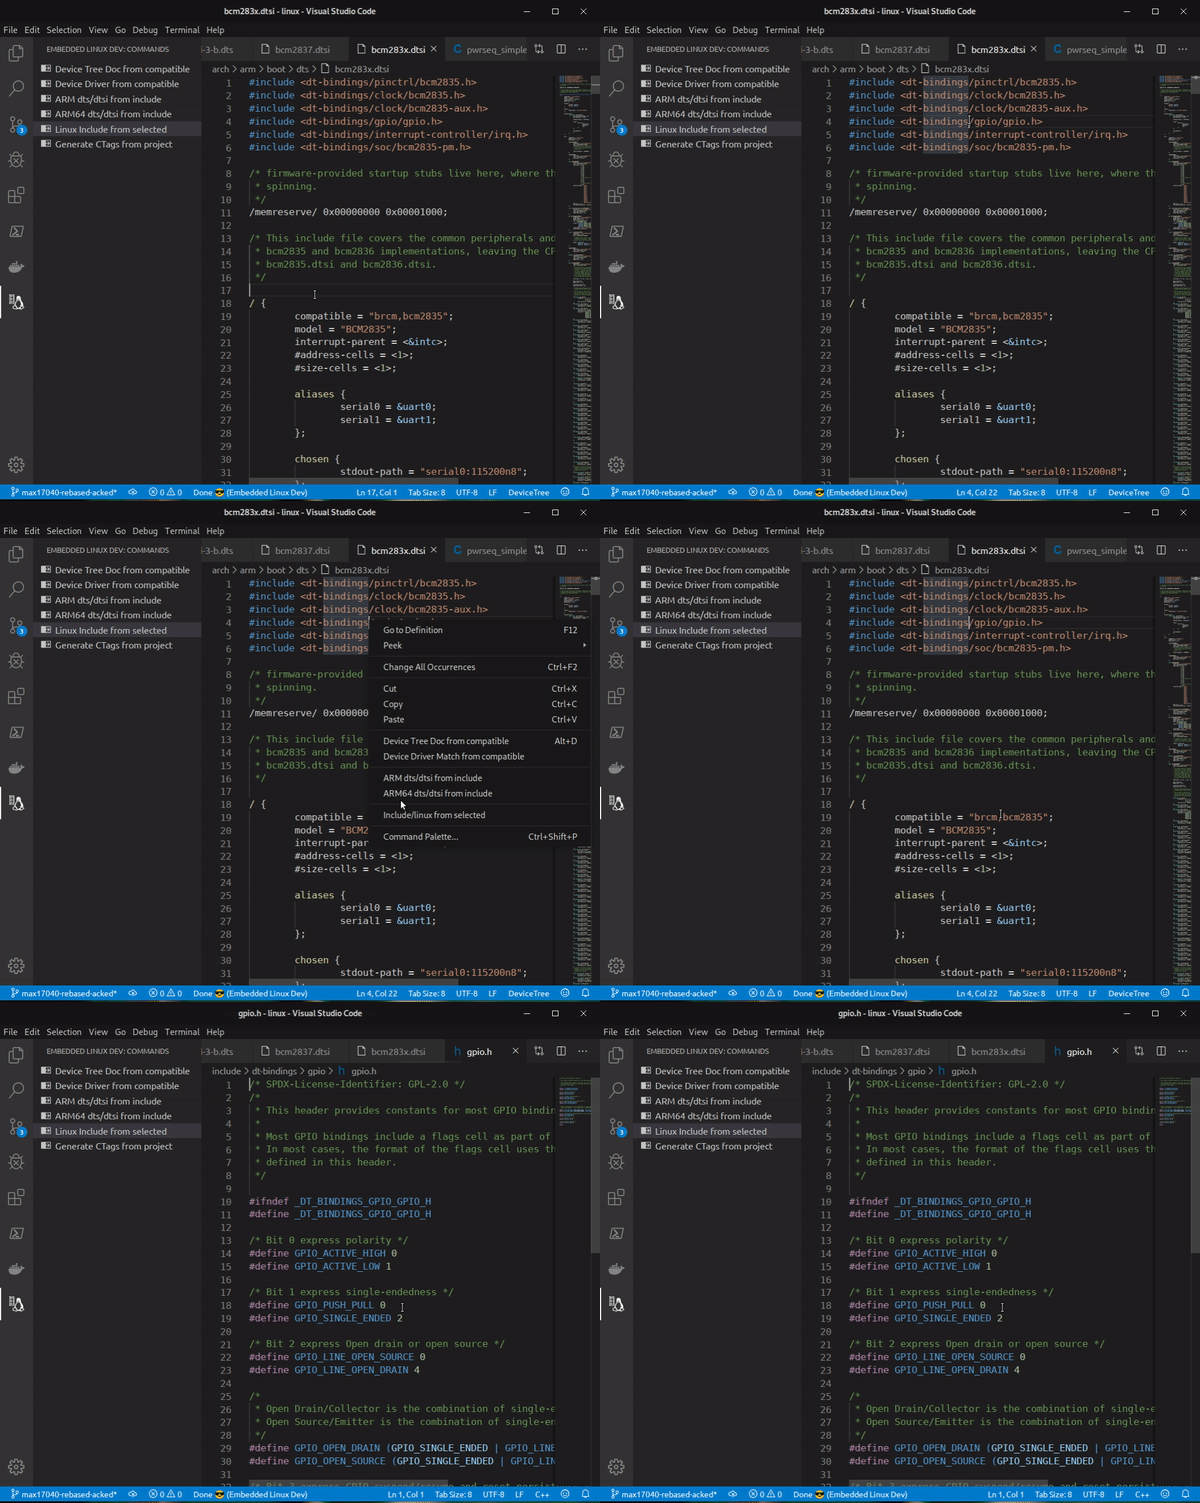
In a device-tree file, “.dts” or “.dtsi”, mouse click on the string of a device-tree include and select the command. VS Code will open the corresponding file:
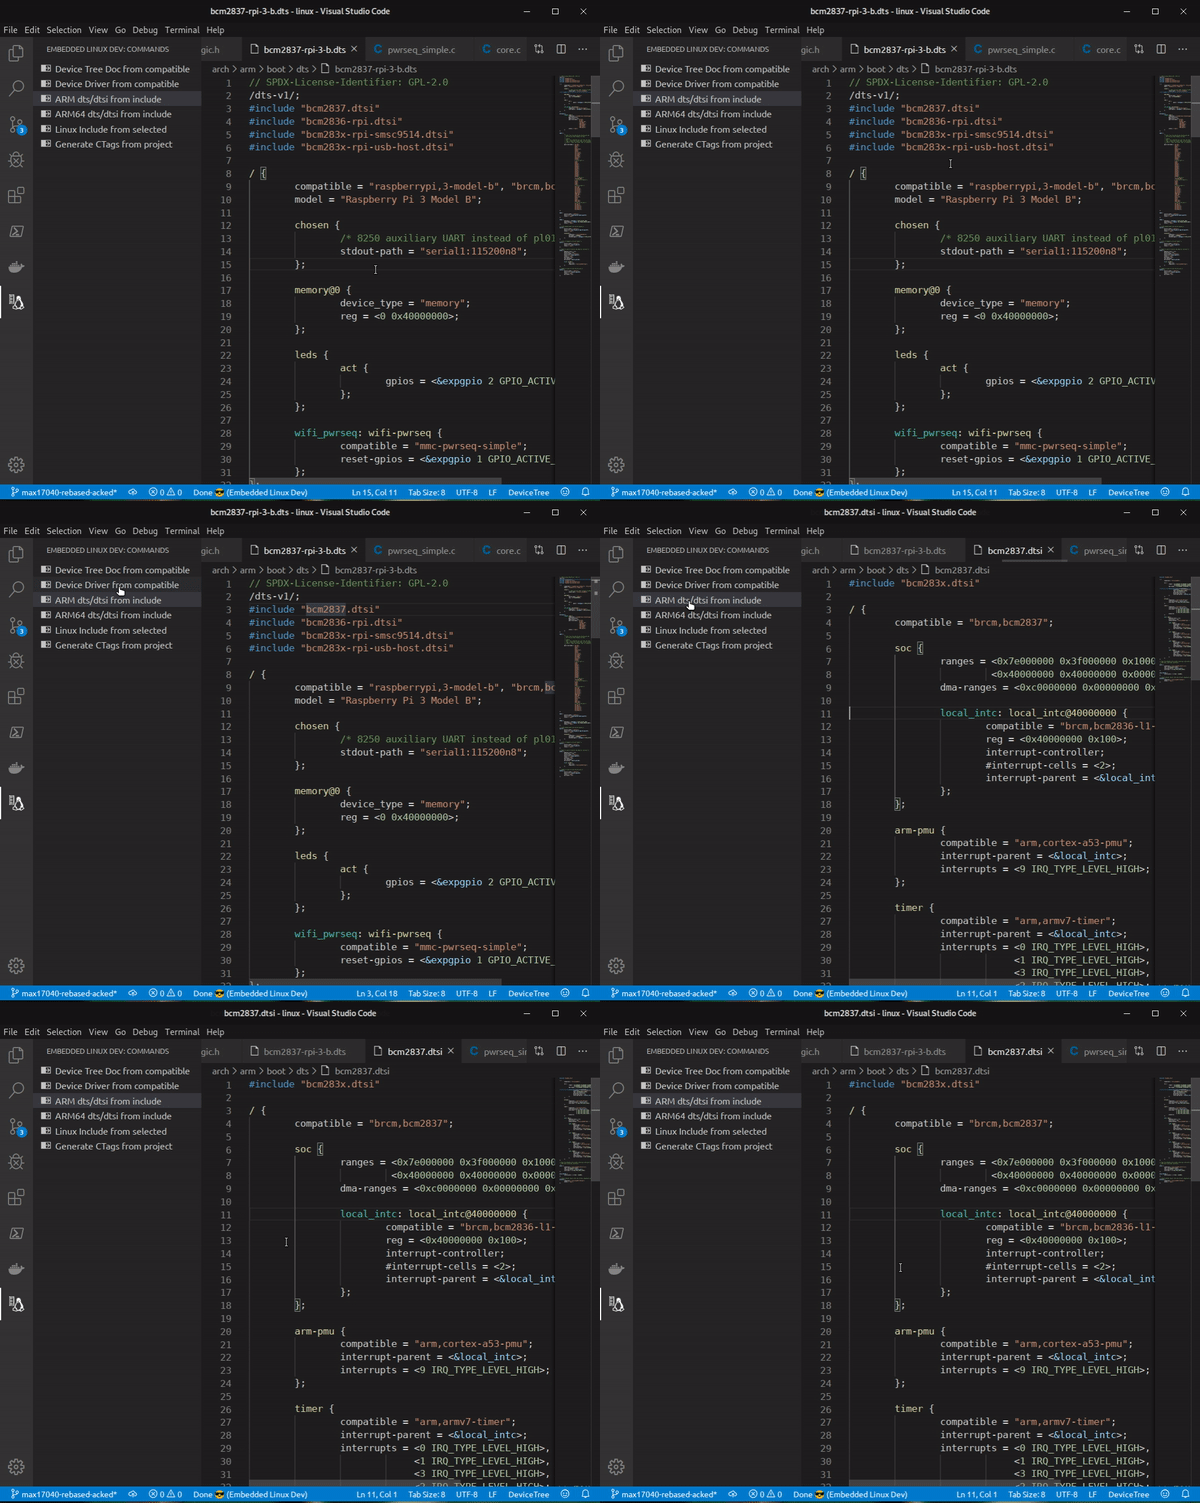
This functionality can also be selected from the right click context menu:
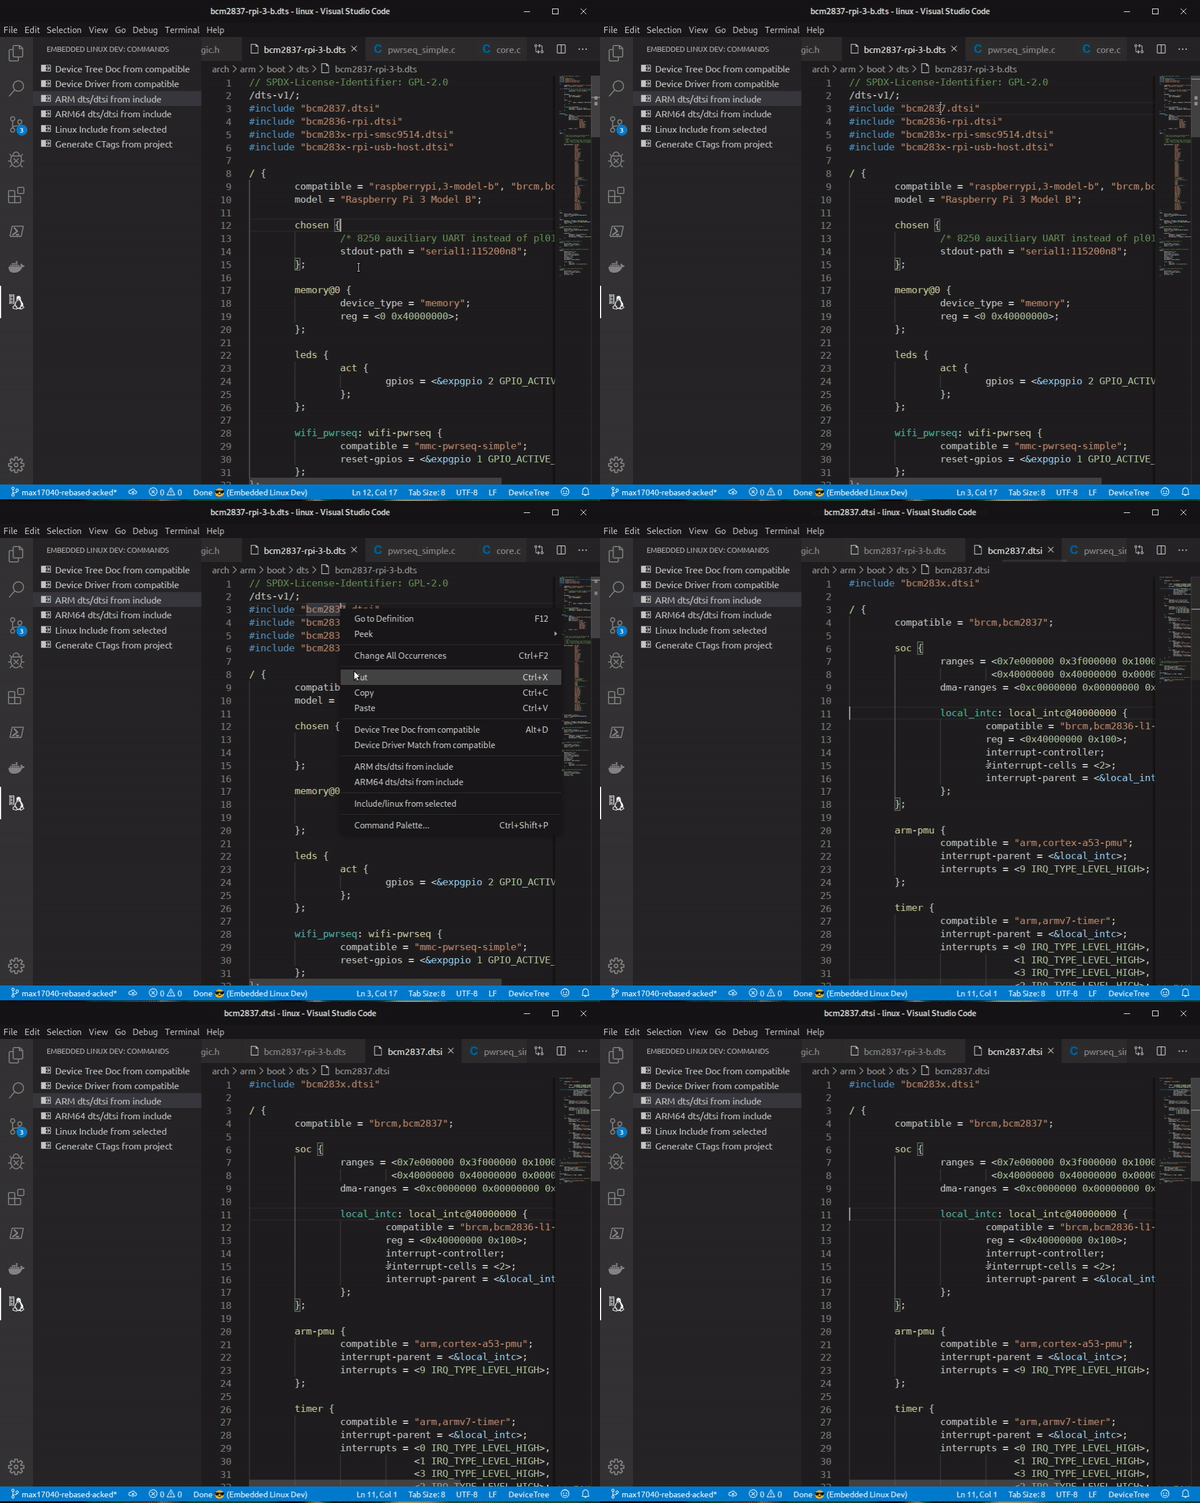
There are two options for this command, one for ARM and other for ARM64, because the devices-tree files for each of these archs are on different paths.
In ".c", ".dts" or ".dtsi" file, mouse click on an include string and select the command. VS Code will open the corresponding include:
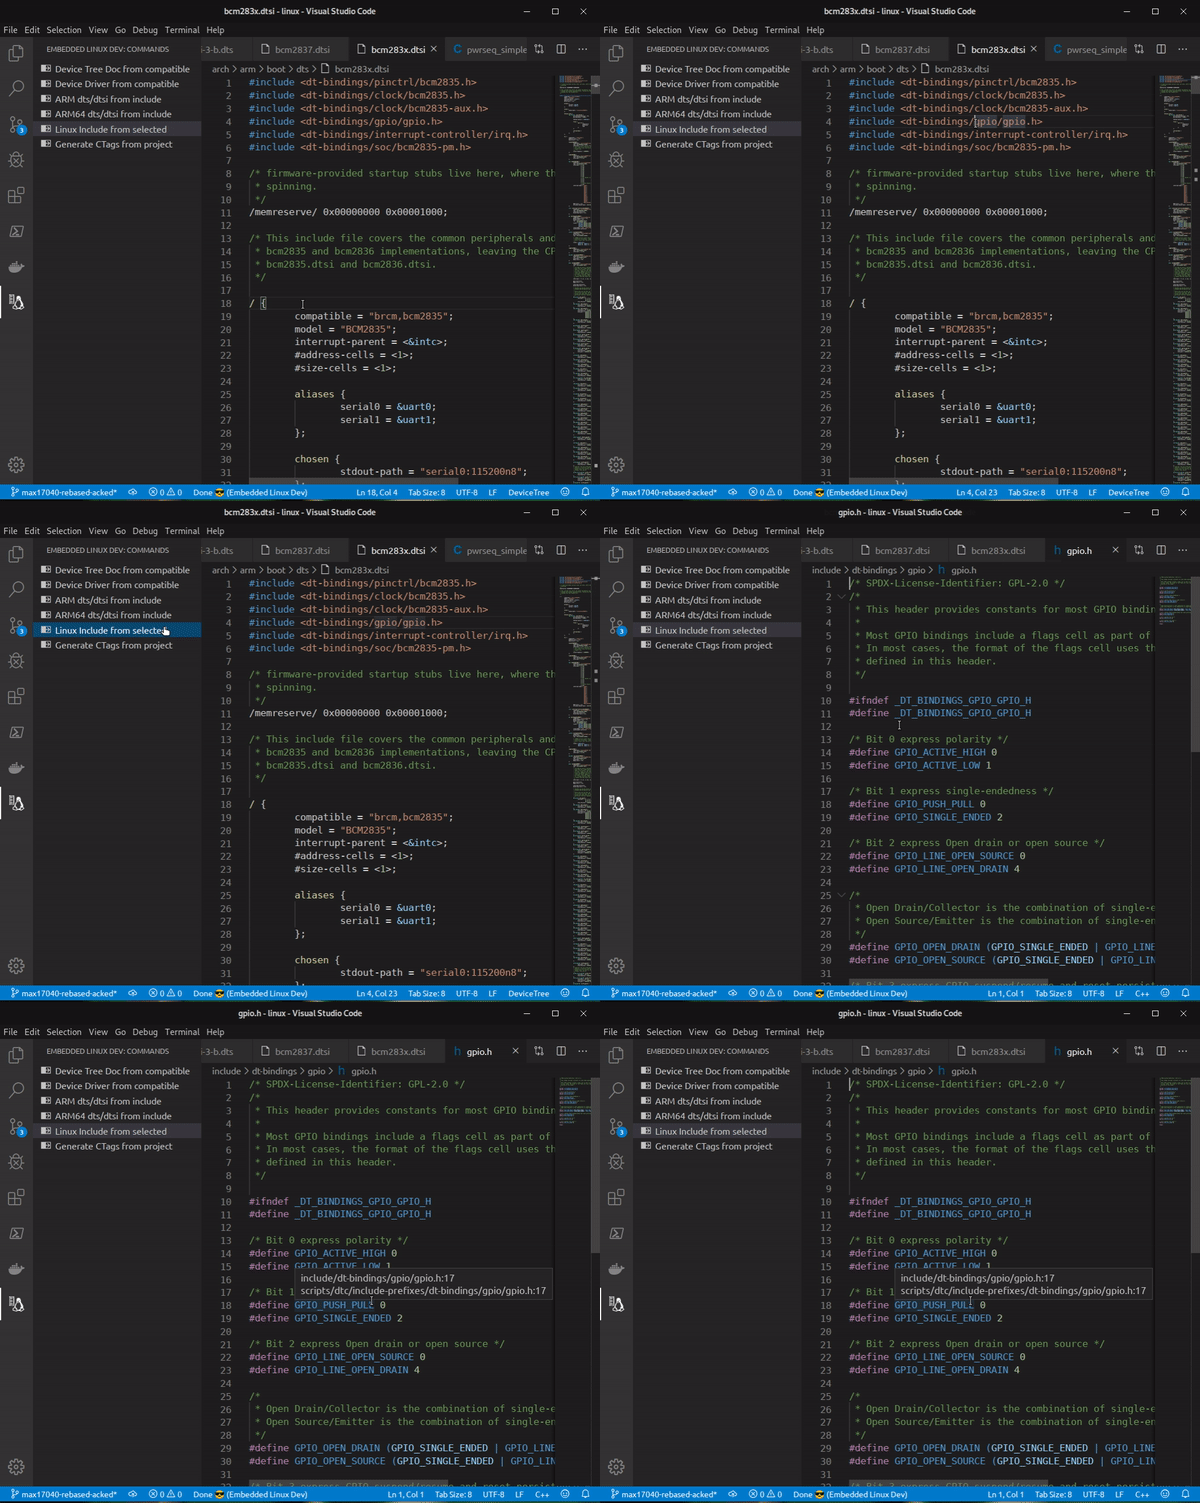
This functionality can also be selected from the right click context menu:
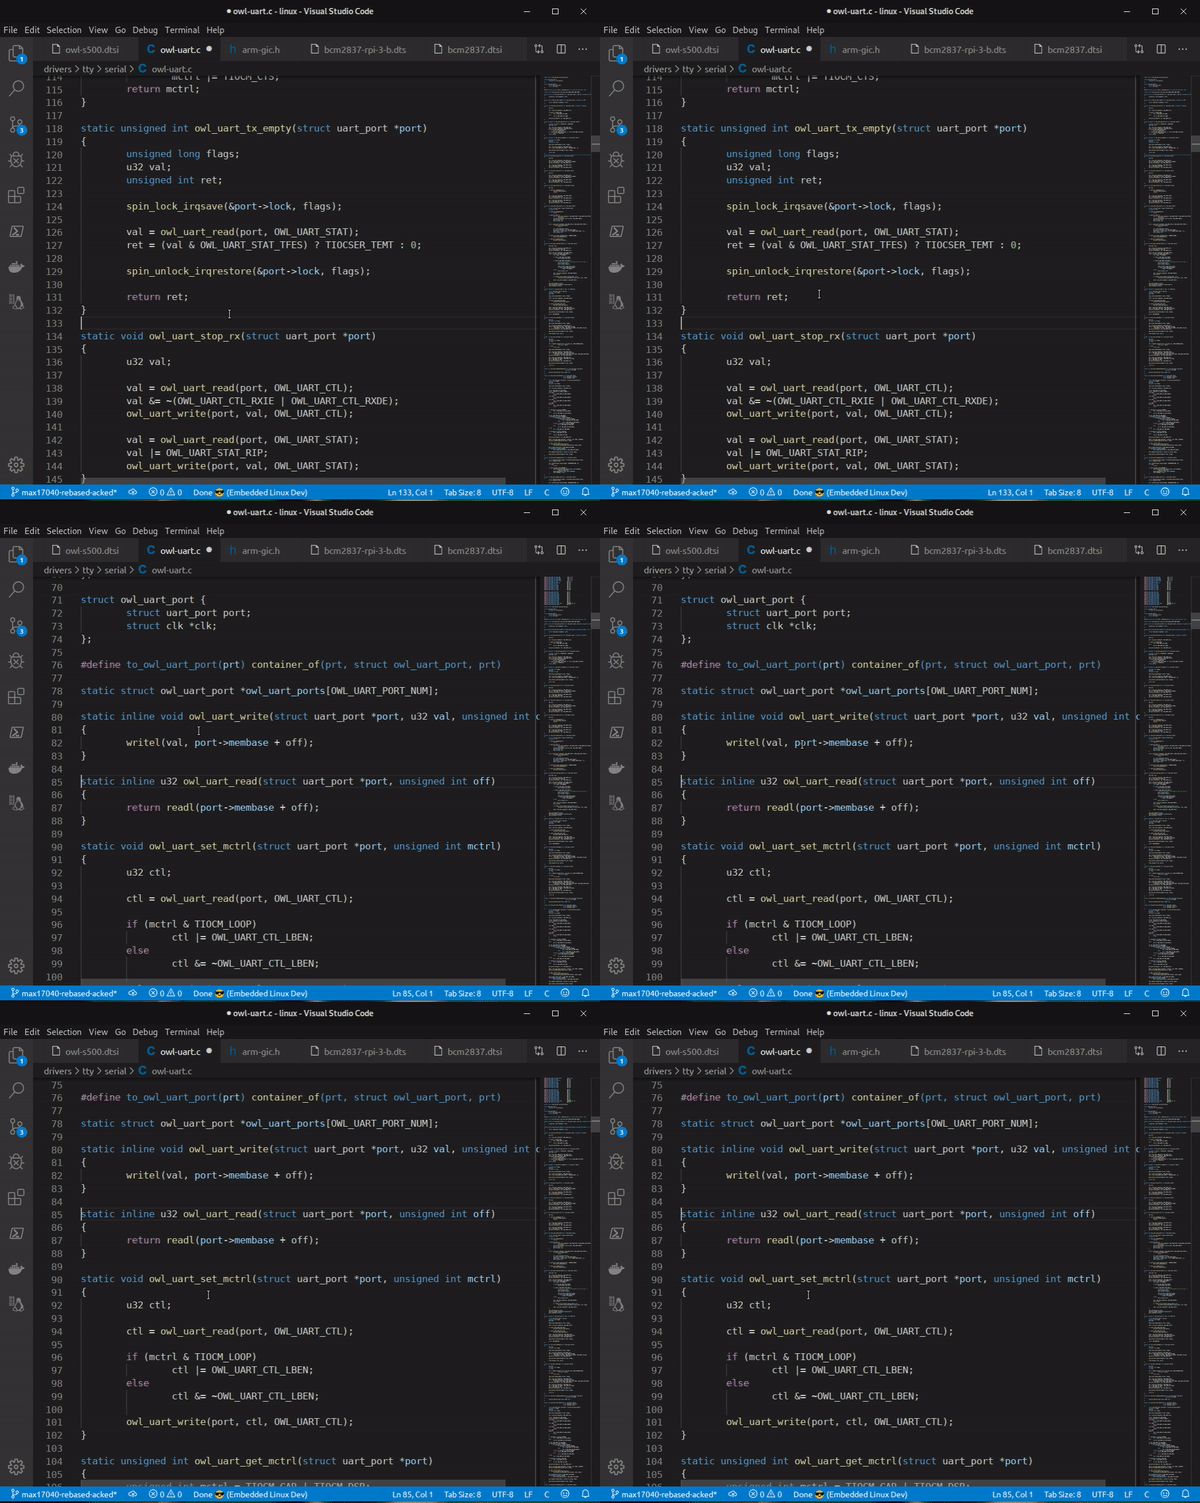
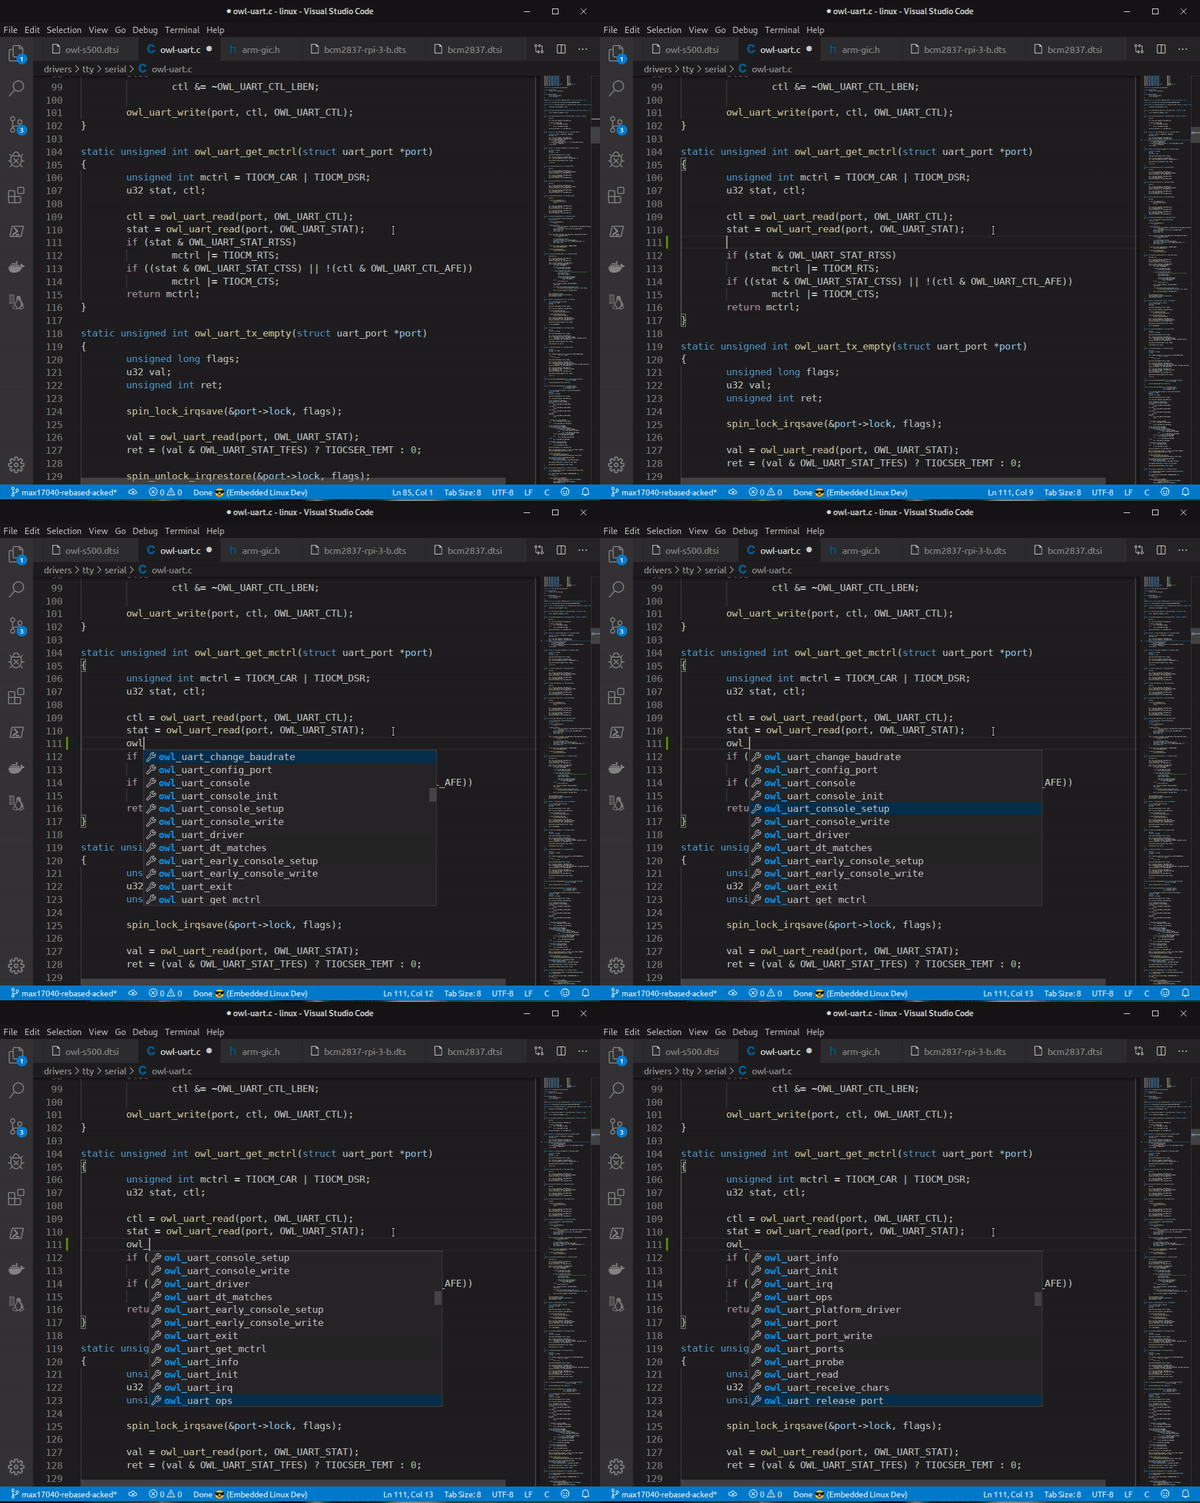
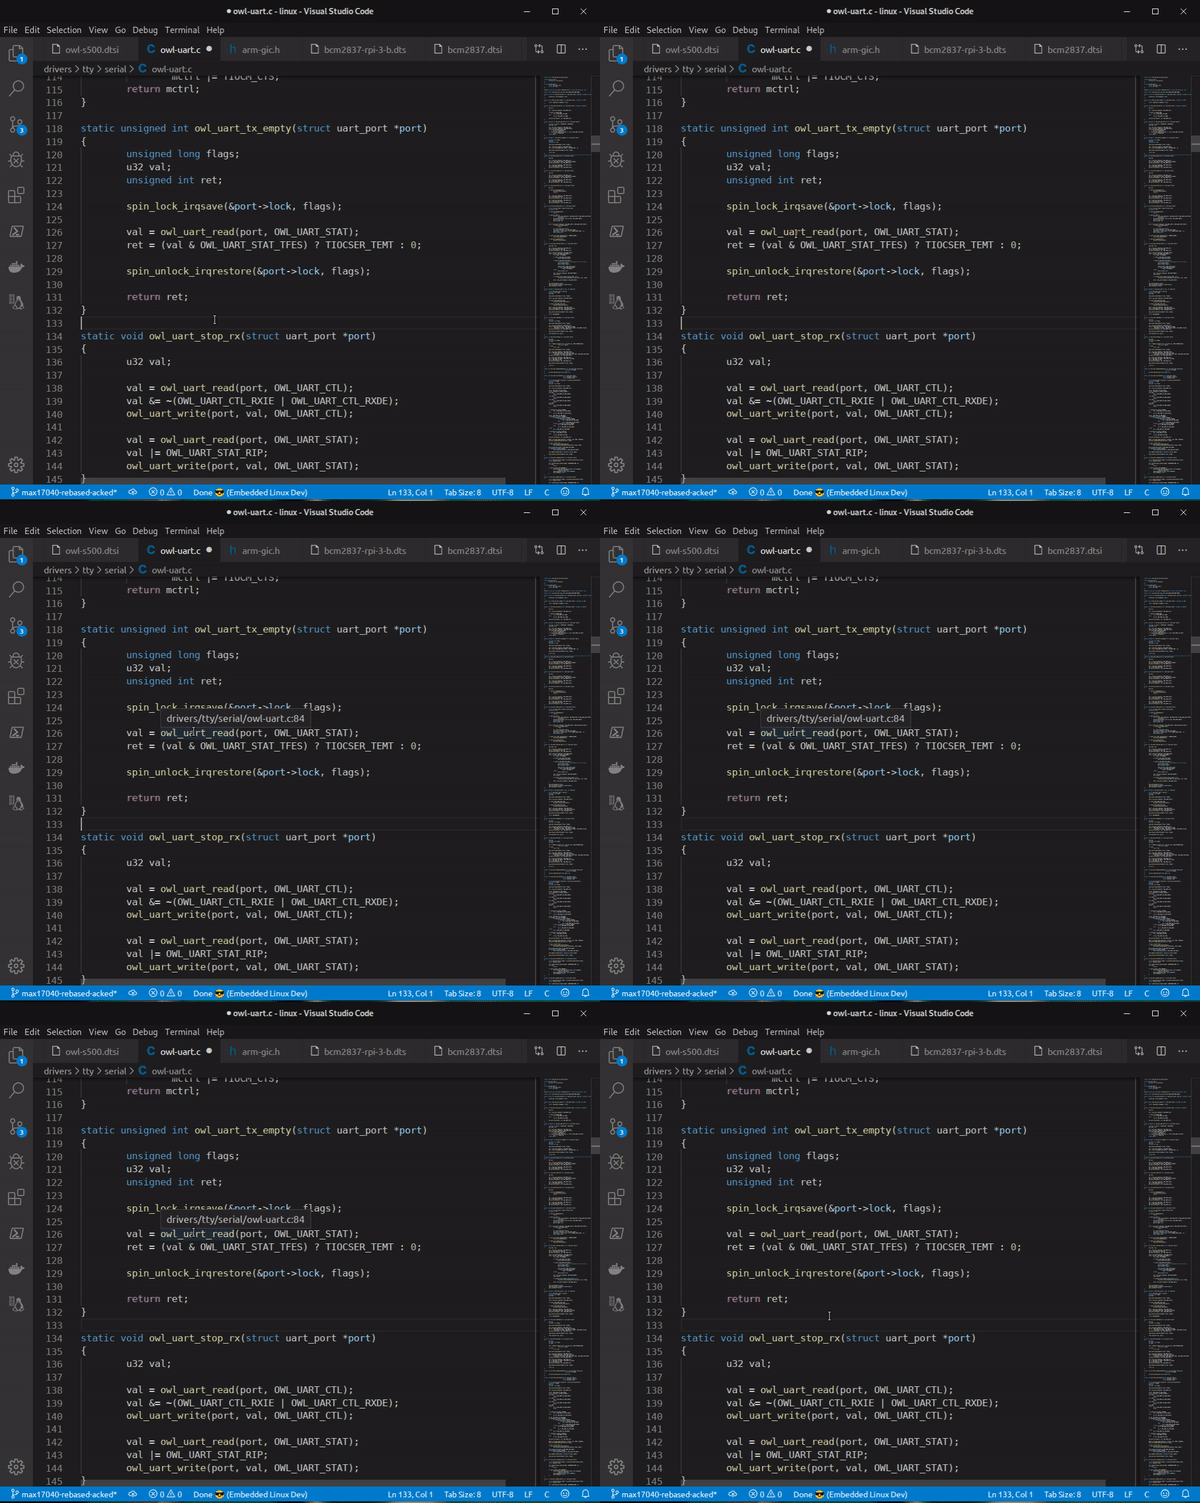
Last but not least. This functionality generates a “.vscode-ctags” file in the root folder that has been opened. This file is the tag index generated by universal-ctags. This file is required to generate the project code navigation:
- Jump to definition:
- Code completion:
- Mouse hover tags:
You can check and open issues on Github repo
Check the CHANGELOG.md
The work here was only possible because of the Exuberant CTags extension, which I used as a base. Thanks Chris Wheeldon.
Thanks also to Trond Einar Snekvik who did a great job in creating a syntax highlighting for Kconfig that I am using here.