Python CLI to plot functions graphs
- Download the latest version
- Extract files
- Inside the directory run
pip3 install .funplot draw -if examples/cos.json --figure cos.png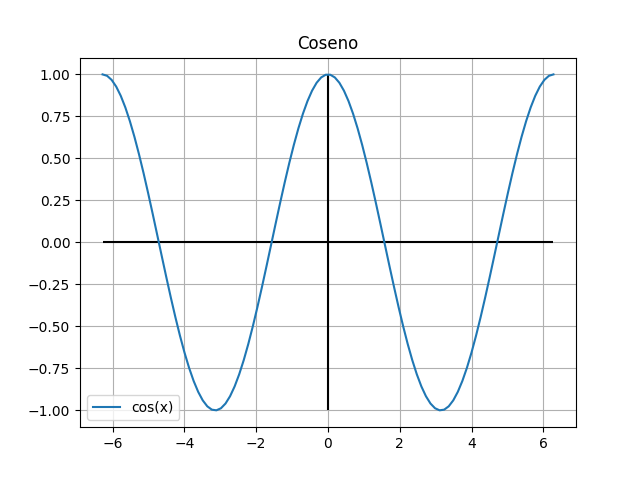
funplot draw -if examples/hyperbole2.json --figure hyperbole2.png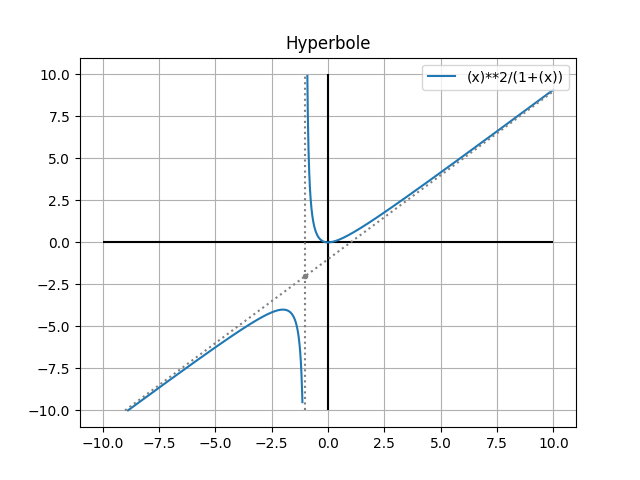
funplot draw -if examples/hyperbole2.json --figure tan_cot.png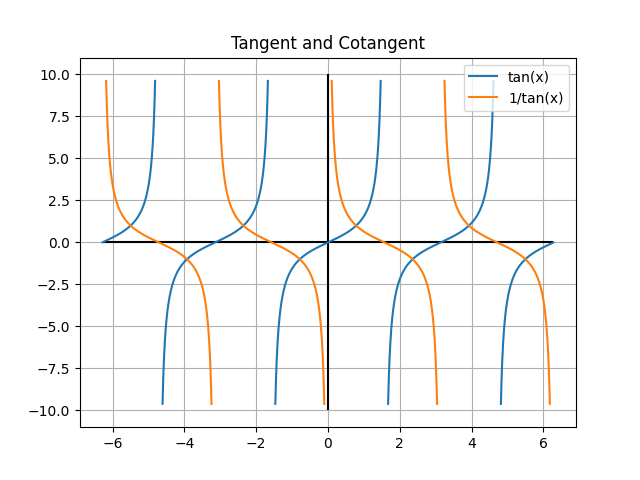
funplot draw <options>The function or list of functions to plot.
funplot draw -f "cos(x)" -f "sin(x)"Domain left limit.
Domain right limit.
Number of points to plot the function.
Function lower limit.
Function upper limit.
Title of the graph.
X coordinate of a vertial asymptote.
Y coordinate of an horizontal asymptote.
A pair of values which represent the slope and intercept of an oblique asymptote.
Prints a better version of the formula in the graph legend.
funplot draw <options> -oa 1 -1X and Y coordinate of a point.
funplot draw <options> -p -1 -2Loads config from a JSON file.
Dumps config to a JSON file.
File name of the output image. The format is inferred from the extension.
funplot draw <options> --figure "filename.pdf"