A Spring Boot log aggregation service that reads a shared log file, parses incoming entries, tracks log metrics, and detects error spikes in near real time.
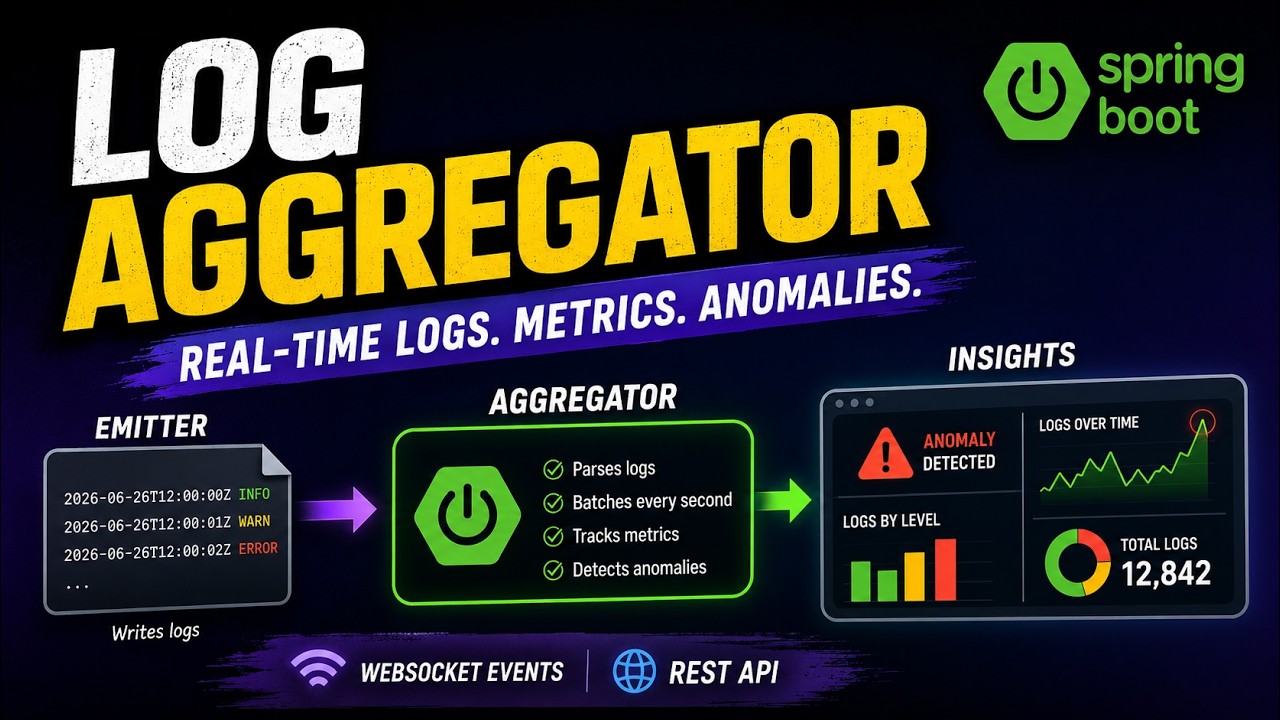
The aggregator is the central processing service for a companion log emitter. It:
- Tails the shared log file
- Parses each log line into a timestamp, level, and message
- Batches new log entries every second
- Tracks total log counts and counts per log level
- Detects error spikes using a sliding window of recent batches
- Publishes WebSocket events for processed batches, metrics snapshots, and anomalies
- Exposes REST endpoints for metrics and anomalies
The emitter is a standalone Python script that writes synthetic log lines into the shared log file. It:
- Writes regular INFO, WARN, and ERROR logs
- Occasionally emits randomized bursts of ERROR logs
- Simulates a noisy application, giving the aggregator real input to process
Both apps read and write the same shared file:
- The emitter appends new log lines to the file
- The aggregator tails the file and ingests new lines
- The aggregator groups logs into batches and updates metrics
- If error volume spikes, the aggregator raises an anomaly event
- Java 21
- Maven 3.9 or newer
- uv
Aggregator defaults are defined in src/main/resources/application.properties:
| Setting | Value |
|---|---|
| Log source path | ../app.log |
| Polling interval | 200ms |
| Batch processing interval | 1000ms |
| Anomaly window size | 5 |
| Anomaly history size | 100 |
From the repo directory:
mvn spring-boot:runFrom the repo directory:
uv run scripts/emit.py app.log- Start the emitter first.
- Start the aggregator in a second terminal.
- Wait a few seconds for logs to accumulate.
- Check the REST endpoints:
GET http://localhost:8080/metricsGET http://localhost:8080/anomalies
- Connect a WebSocket client to:
ws://localhost:8080/ws/events
- Watch for events such as:
BATCH_PROCESSEDMETRICS_SNAPSHOTANOMALY_DETECTED
- Let it run until an error spike occurs, then confirm an anomaly appears in
/anomalies.
Each log line must follow this format:
- ISO-8601 timestamp
- Log level
- Message
Example:
2026-06-26T12:00:00Z ERROR Database timeout