


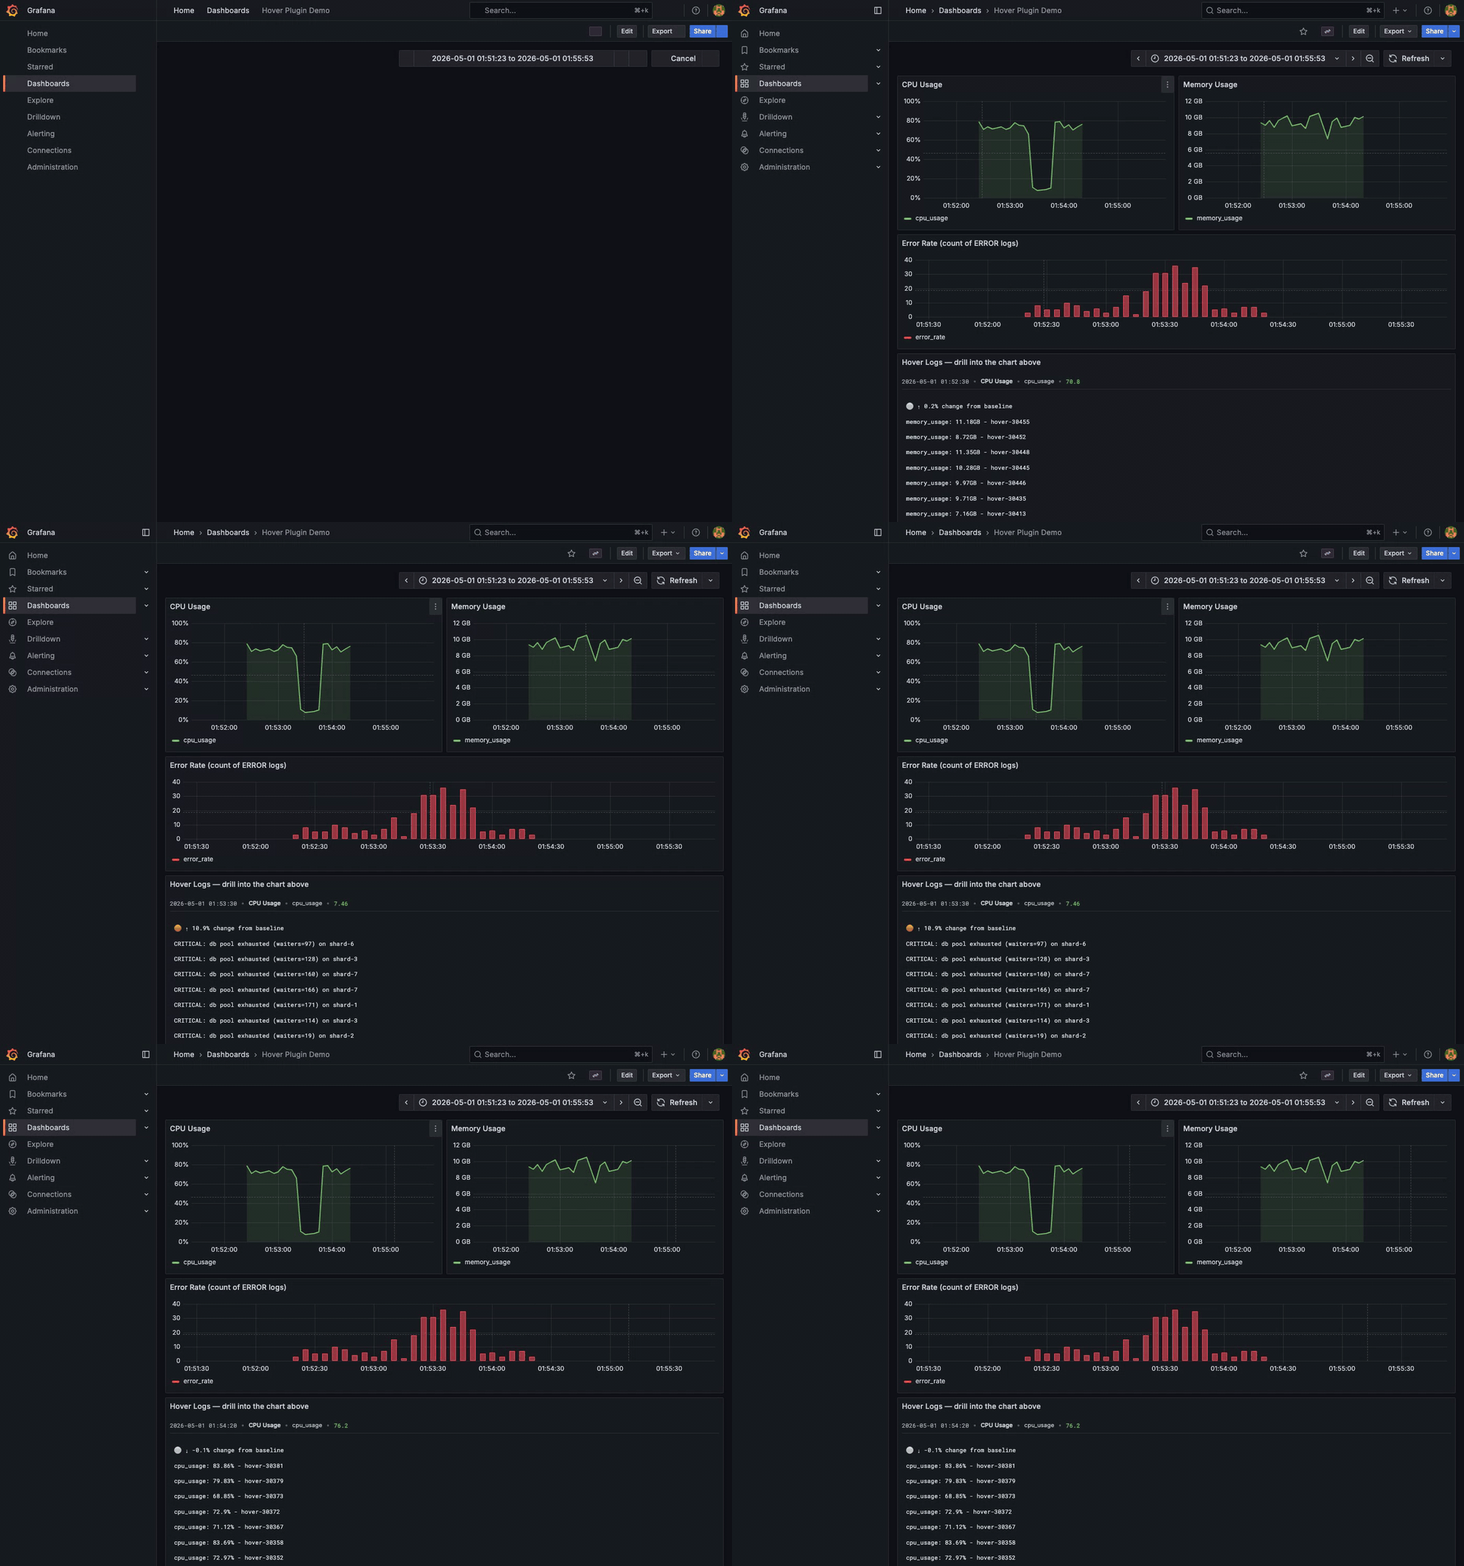
A Grafana panel plugin that shows logs from the same time window as the metric you're hovering on. When the cursor moves over a data point in any chart on the dashboard, the panel sends the metric name, dashboard, panel title, and time window to a configured log analysis API and renders the returned log groups.
The repo also ships a Go backend (pkg/main.go → internal/) that
implements the API on top of ClickHouse, with Jensen-Shannon divergence
analytics over per-window template histograms.
- Add the Hover panel to a dashboard.
- Set the API endpoint in the panel options.
- Hover any chart. The panel reads the metric name, the panel title, the dashboard name, and the cursor's chart-time, then POSTs them to the API.
- The API returns log groups; the panel renders them ranked by relevance and tagged with a percent-change-from-baseline indicator.
The repo ships an end-to-end demo that brings up ClickHouse + Grafana + the OTel-fed ingest pipeline and lands on a live dashboard with a pre-seeded incident — the same setup that produced the GIF above.
Prereqs: Docker Desktop, Python 3, and the Rust
log-ingest-service
running on host:4317 (the demo script verifies this and exits early
if it's missing).
./demo/run.shTotal time ~2 minutes. The script narrates each phase, then prints a dashboard URL pointing directly at the engineered incident:
docker compose up -d— ClickHouse, Grafana with the plugin mounted from./dist, OTel collector pointing at the host's ingest service.- Streams 60s of mixed normal traffic so the analyzer's trailing baseline has data to compare against.
- Calls
demo/incident.sh— 30s of distribution-shifted traffic: cpu drops to 5–15%, ERROR rate 5×, and a brand-newCRITICAL: db pool exhausted…template appears that didn't exist in baseline. - Streams 30s of post-incident normal traffic.
- Prints a dashboard URL pre-set to the incident window ± 2 minutes.
When you hover the dip in CPU Usage, the Hover Logs panel ranks
CRITICAL: db pool exhausted… first with a red ↑ indicator. Hover the
flat regions either side and it falls back to baseline templates.
If the stack is already up, skip the cold start with
./demo/incident.sh (then read /tmp/incident_window.txt for the
absolute window). Tear down with docker compose down -v.
See demo/README.md
for the rest of the knobs.
grafana-cli plugins install hover-hover-panel- Download the latest release from GitHub Releases
- Extract to your Grafana plugins directory:
# Linux
unzip hover-hover-panel-*.zip -d /var/lib/grafana/plugins/

# macOS (Homebrew)
unzip hover-hover-panel-*.zip -d /usr/local/var/lib/grafana/plugins/

# Docker
# Mount the plugin directory in your docker-compose.yml
volumes:
  - ./hover-hover-panel:/var/lib/grafana/plugins/hover-hover-panel
- Restart Grafana
Set in the panel editor:
| Setting | Default | Notes |
|---|---|---|
| API Endpoint | (required) | URL of the log analysis API. Receives POST / with the JSON below. |
| API Key | empty | Sent as Authorization: Bearer <key> if non-empty. |
| Time Window (ms) | 60000 | Width of the window centered on the hover time. |
| Max Logs | 500 | Cap on log entries rendered. |
| Max Log Length | 10000 | Per-entry character cap; over-cap entries truncate. |
| Log Truncate Length | 120 | Per-entry threshold for the expand/collapse toggle. |
The Hover panel sends POST requests to your API endpoint with this JSON payload:
{
  "org": "1",
  "dashboard": "Production Metrics",
  "panel_title": "CPU Usage",
  "metric_name": "system.cpu.usage",
  "start_time": "2025-01-13T10:30:00.000Z",
  "end_time": "2025-01-13T11:30:00.000Z"
}
Headers:
Content-Type: application/jsonAuthorization: Bearer <api-key>(only if API key is configured)
Your API should return log groups with representative logs and change metrics:
{
  "log_groups": [
    {
      "representative_logs": [
        "2025-01-13 11:15:23 ERROR High CPU usage detected",
        "2025-01-13 11:15:24 WARN Thread pool exhausted"
      ],
      "relative_change": 150.5
    }
  ]
}
Fields:
log_groups: Array of log group objectsrepresentative_logs: Array of log message stringsrelative_change: Percentage change from baseline (used for color coding)
The panel color-codes log groups based on the relative_change value:
- 🔴 Red: > 50% increase (critical)
- 🟠 Orange: 10-50% increase (warning)
- 🟢 Green: < -10% decrease (improvement)
- ⚪ White: -10% to 10% (neutral)
A reference API implementation backed by ClickHouse lives under
pkg/ + internal/. The Go backend reads templates that the
log_analysis ingest
service has already written and computes JS divergence over per-window
template histograms.
- Grafana 9.0+.
- A log analysis API at the configured endpoint. The bundled Go backend uses ClickHouse; supply your own if you'd rather hit Loki / ES / etc.
- The dashboard's "Shared crosshair" setting on, so hover events fire on all panels.
No logs appearing when hovering:
- Check browser console for API errors
- Verify API endpoint is reachable
- Ensure API returns correct JSON format
- Check CORS settings on your API
"Waiting for hover data..." message:
- Move your mouse over a data point in another panel
- Enable shared crosshair in dashboard settings
- Ensure other panels have time-series data
Plugin not loading:
- Check Grafana logs for errors
- Verify plugin files are in the correct directory
- For unsigned plugins, add to
allow_loading_unsigned_pluginsin grafana.ini
Contributions are welcome! Please:
- Fork the repository
- Create a feature branch
- Make your changes
- Add tests if applicable
- Submit a pull request
Apache 2.0 - see LICENSE for details.
- Issues: GitHub Issues
- Discussions: GitHub Discussions
- Author: Ankil Patel
- Website: ankilp.github.io
Built with Grafana Plugin Tools.