Please refer to link for code. I also recommend reading the notebook on Kaggle.

- Conducted segmentation studies on a physical FMCG store customer dataset, which included demographic data of 2000 customers, to identify seven distinct customer segments and perform customer profiling.
- Developed general customer portraits for each segment, enhancing the store's understanding of customer preferences and needs, leading to increased business revenue and customer retention.
- Leveraged data insights to anticipate age ranges within each customer group based on education, providing valuable context for subsequent clustering analysis.
- Uncovered the underlying population structure and gauged the store's popularity with different customer types through insightful visualizations.
- Utilized unsupervised clustering algorithms (K-Means, DBSCAN, Gaussian Mixture, and Agglomerative Clustering) to pinpoint the optimal number of customer groups.
In this project, the customer data has been analyzed to perform Customer Segmentation for a given FMCG store. FMCG stores are these where they sell fast-moving consumer goods which have a short shelf life because of high consumer demand, such are milk, fruit and vegetables, and baked goods.
The best clustering algorithm turned out to be the Gaussian Mixture algorithm, which predicted that customers should be divided into 7 groups based on their demographic data from bonus cards. The general portraits of the customers from each cluster have been created and are shown in the figure below.
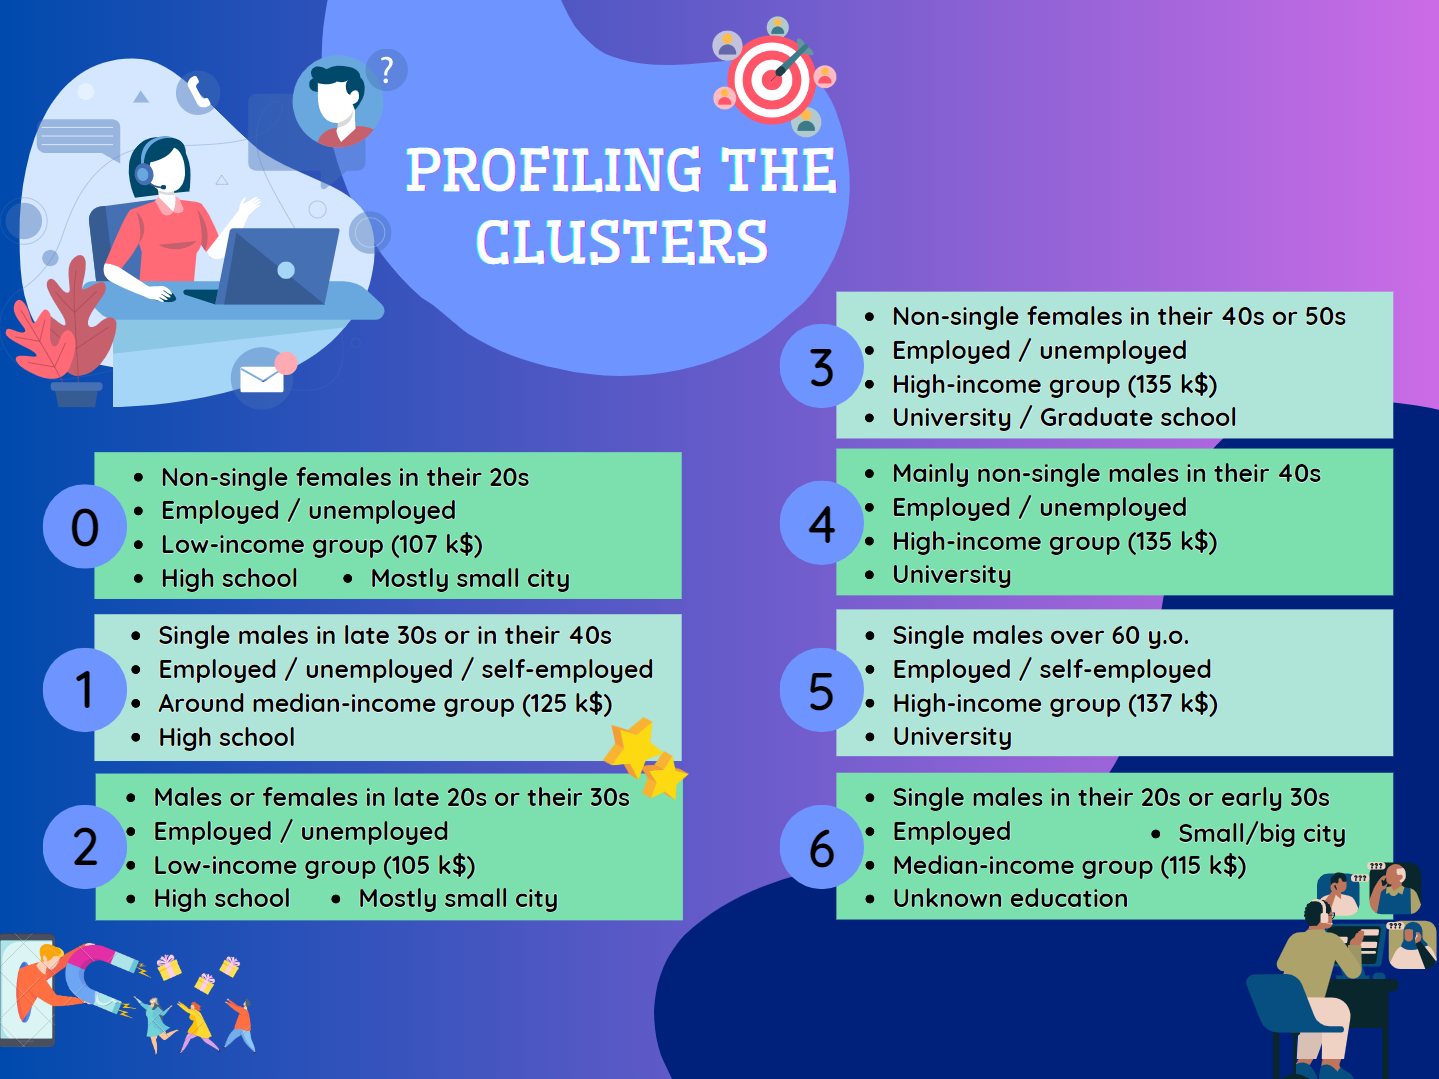
The summary of each cluster incorporates the ideal customer's biological sex, age, marital status, category of occupation, median annual income for the group, level of education, and the size of the city the customer lives in. If some of the characteristics are not mentioned in the cluster description, the cluster spans all options or the entire range of values. The ones mentioned are considered to be prevailing over other options of the characteristic.
Python Version: 3.7.12
Packages: numpy, pandas, matplotlib, seaborn, plotly, scipy, sklearn.
Customer segmentation is the process of dividing customers into groups based on common characteristics such as demographics, behavior, or preferences. It is crucial for businesses because it allows them to tailor their marketing, sales, and customer service strategies to specific groups of customers. For example, it can be used to improve customer understanding. By segmenting customers, businesses gain a deeper understanding of their needs, preferences, and behaviors. This allows them to better serve their customers, create more targeted marketing campaigns, and improve customer satisfaction.
In addition, when businesses understand their customer segments, they can create more targeted marketing campaigns that are more likely to resonate with the intended audience. This can increase the effectiveness of marketing efforts, leading to more sales and revenue. Customer segmentation also allows businesses to create personalized experiences for different groups of customers, which can lead to increased customer loyalty and retention. Moreover, by targeting specific customer segments, businesses can save money on marketing and advertising by only reaching out to those who are most likely to buy their products or services.
By understanding their customers better, businesses can create more effective strategies that lead to increased customer satisfaction, and, also, to higher revenue.
Since I was a child, I have always wondered how the store decides which products should be on sale on a specific day and why sometimes the product becomes sold out in a matter of seconds, and the other day nobody even pays attention to it. Why have I never seen certain products with red price labels? How does the store decide how often to buy some groceries, not to mention how they choose the appropriate number? It was something I considered thought-provoking until I actually understood how it works and how easily one can make a wrong decision, which will lead to a decrease in revenue and customer dissatisfaction.
After realizing that such decisions rely on the analysis of customers, products sold, and products people buy on special occasions, I have started asking myself, what customer group do I belong to? Based on the spent money only, I can roughly estimate what should the group I belong to look like. However, there is definitely more to it than I can see. But how actually can the customer groups be identified? This question piqued my interest in this field. That is one of the reasons why I decided to explore it on my own and get a feeling of what the analysis and segmentation process actually looks like in the real world.
My goal for this project was to implement different clustering algorithms to identify the main groups of customers for the dataset. Also, after finding these groups, my objective was to characterize these groups with the help of visualization tools and to make an attempt to understand consumer behavior and gain a deeper understanding of the challenges and opportunities within this industry.
So the outline of the project looks roughly like this.
At first, I looked through the whole dataset, visualized some of the relationships, and identified the critical features in the dataset that allowed me to find out more about the population structure and gave me an opportunity to approximate the popularity of the store with certain types of customers. For example, the Education feature is one of these, and it reveals that, in the place where the mall is situated, there are a large number of people with high school diplomas at most and a surprisingly low number of people who finished their graduate studies. This information, in turn, gave me a hint of what age ranges should be expected for each customer group based on education only. This data assisted me in comprehending what kinds of clusters I anticipated to see after actually performing clustering, and these insights emerged to be extremely helpful in further comparison of the results of different clustering algorithms.
A Principal Component Analysis has been performed for dimensionality reduction. For the clustering itself, I have run four easily distinguishable clustering models, which were K-Means, DBSCAN, Gaussian Mixture, and Agglomerative Clustering, on the PCA components to cluster customer population into different segments and have performed optimization for each of these models separately to receive clusters best describing the data. Next, after choosing the best clustering algorithm, I have created pictures of the customers from each group, which can act as a guide for the mall's marketing and advertising to reach their ideal customers.
Here are some highlights from the notebook's EDA section.
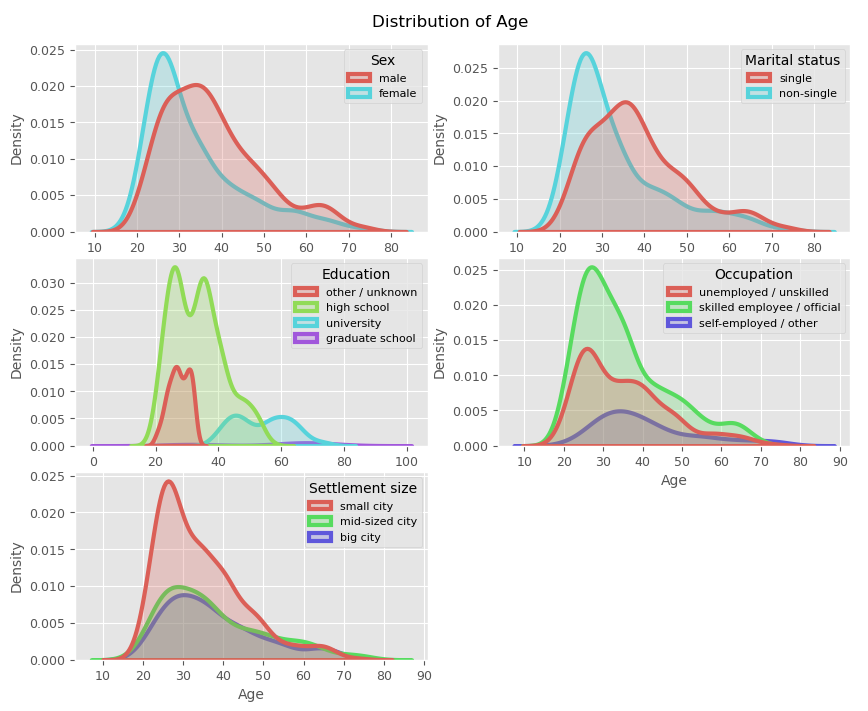
The plots above show us the distribution of age with respect to different categorical values in our dataset. First, recall that the ratio of the number of females to the number of males in our dataset is almost one, i.e. the dataset contains around the same number of women as the number of men. That said, we see that there are more older men than women in the data, with the median age for men 36 years and women 30 years.
Concerning marital status, the plot suggests that the people who are 'single' are usually older than those who are 'non-single'. In the central left plot, we see that the data consists of mainly high school graduates in their 30s, as well as there are people a bit younger than the ones mentioned in their 20s who either have not filled in this section or have other educational attainments. Usually, the people who have graduated from university are in their 50s, in contrast to those who finished their graduate studies are older, with a median age of 65.
As for the occupation variable, we see that most customers are in their 30s for each of the curves. So we can't really tell what the customer's occupation is if we were to come across one of the customers unless we will be relying on probabilities based on the number of members in each category, yet, this feature and the age aren't enough to form distinct clusters of customers. The same can be said about the settlement size.
Note that other takeaways from the EDA can be found in the notebook.
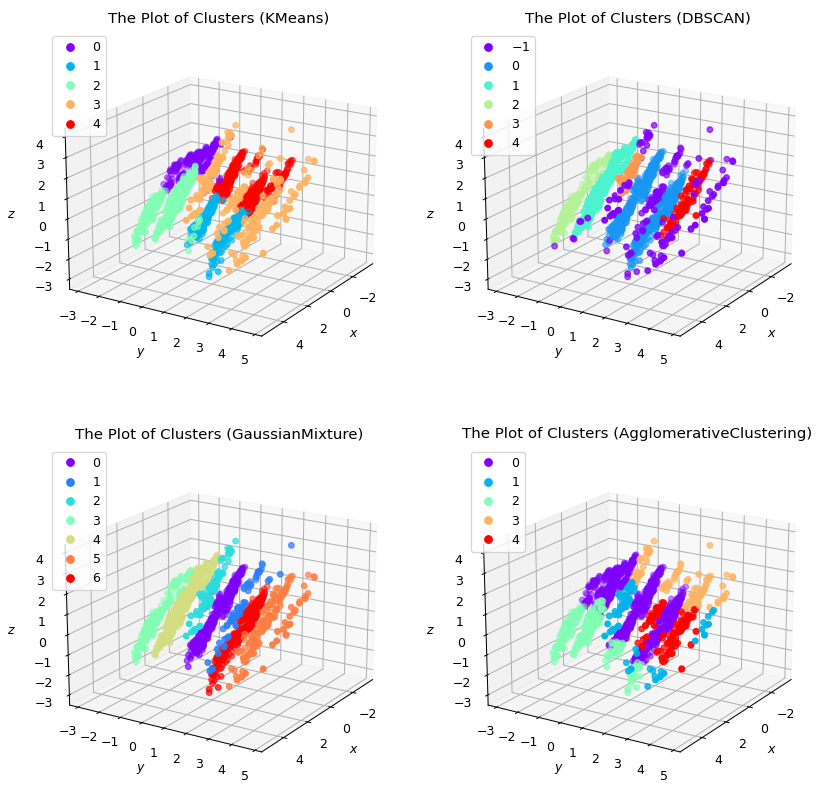
Out of all four algorithms I have used, I have chosen the Gaussian Mixture model to be the most suitable for the problem at hand because K-Means and Agglomerative Clustering split visible clusters into halves, and DBSCAN, even though it fits the data well, predicts one cluster to be representing all outliers in the dataset, which would not make sense for customer profiling. Gaussian Mixture seems to be the best model because it predicts visible clusters better than DBSCAN.
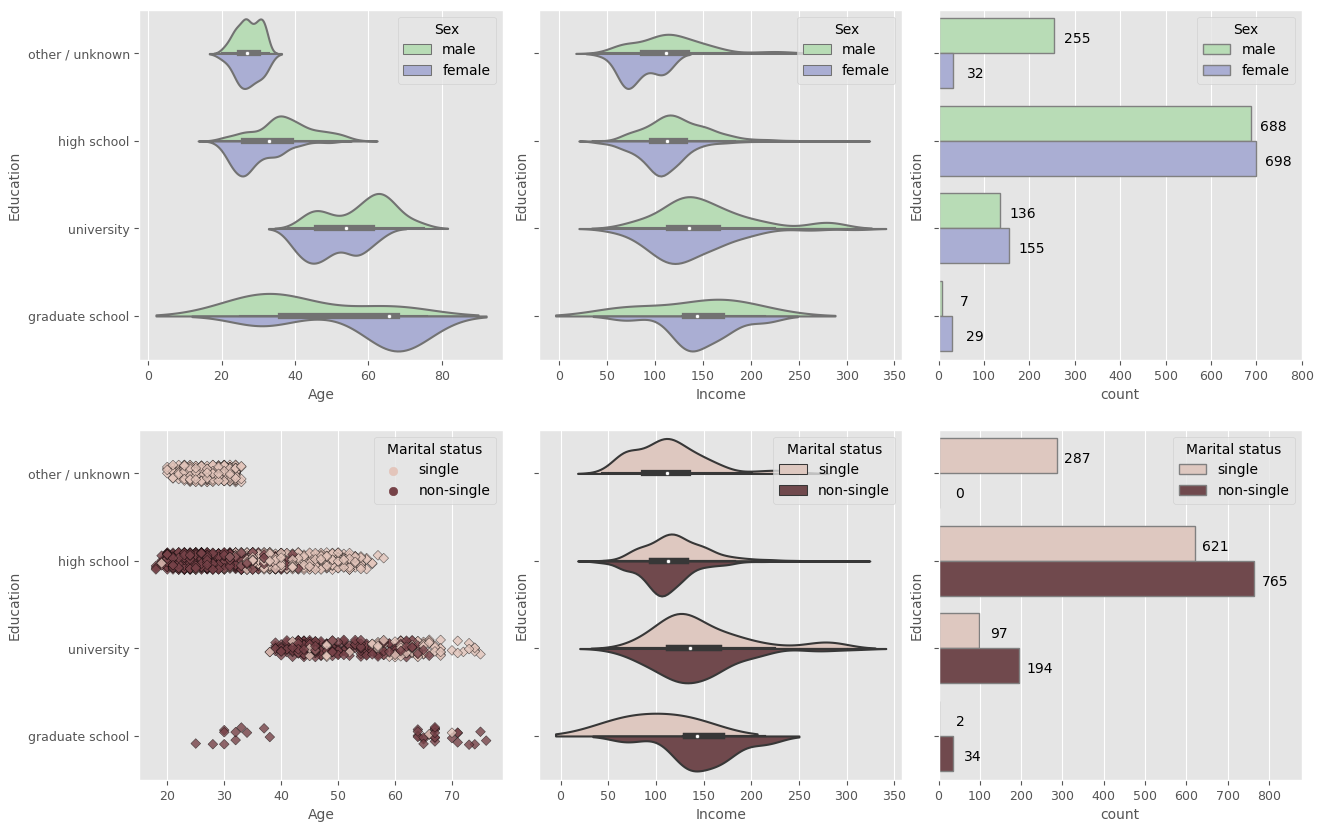
To see what clusters tell us about customers who belong to them, I have taken a look at the features in the light of clusters using visualization tools and then summarized the information from all plots in the picture right after the charts.
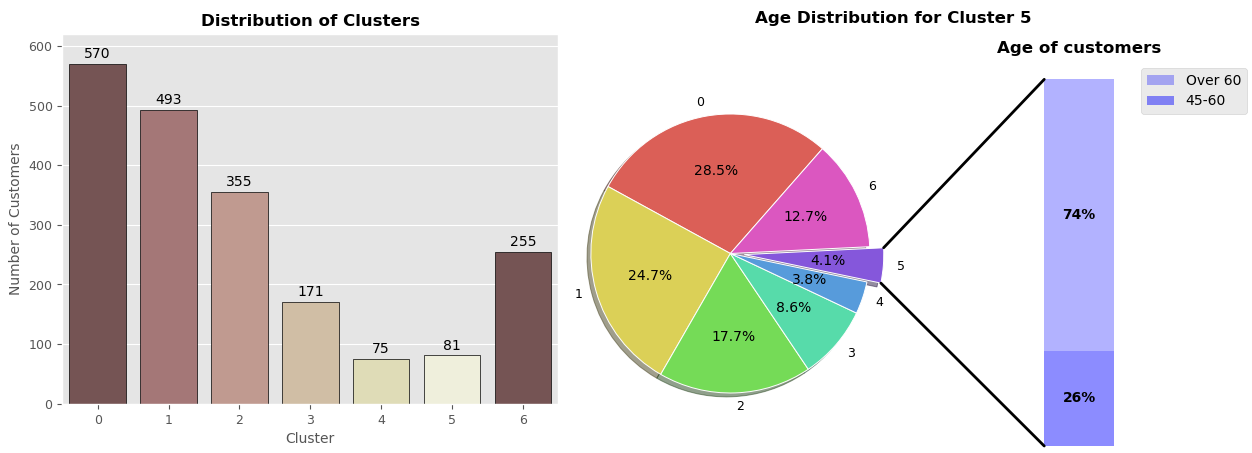
The customer profile of the cluster may vary depending on how many people are in that cluster, whether it's 500 or 100. The clusters with greater numbers of customers do seem trustworthy since they capture all similarities between customers and generalize well. However, small clusters are not necessarily unreliable because they might consist of the underrepresented population visiting the mall. Take cluster no.5. It has 81 members and consists mainly of people over 60 years old.
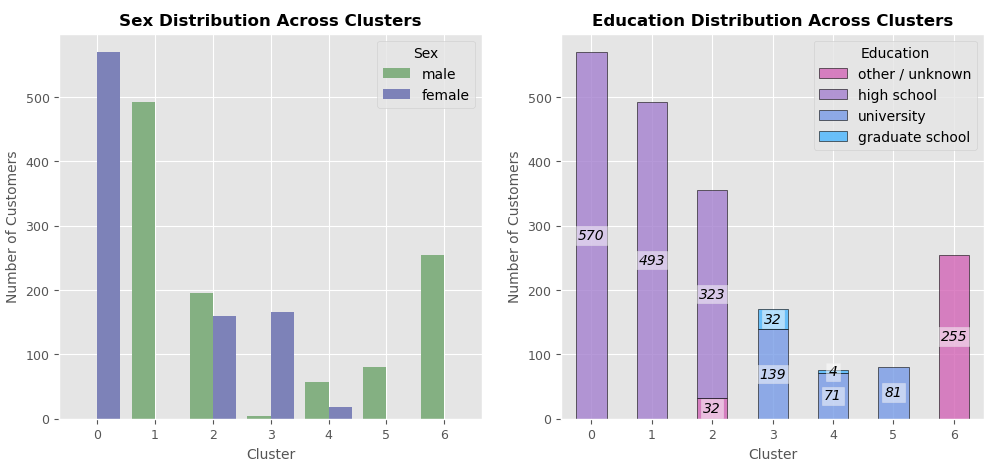
If we continue looking at cluster no.5, we may notice that it includes only males who graduated from university. That alone tells us a lot about the cluster.