English · 한국어
A VS Code extension for the moments a CMake project stops you over linking.
| Feature | The question it answers | When you reach for it |
|---|---|---|
| Link for include | what do I have to link to use this header | you wrote an #include and got stuck |
| Targets | what links what, and above all who links this | reading the structure, judging blast radius |
| Linker Map | what is eating the size, and what grew since the last build | the binary got bigger |
| Build Time | what is eating the time, per target and per step | the build got slower |
| Compiled With | the effective macros and include paths for this file | an #ifdef is not firing |
| Cycles / Unused | link cycles and libraries nobody uses | tidying the structure |
| Compare Trees | where two build trees diverge | it builds here and breaks there |
It does not parse CMakeLists.txt. It reads what CMake and the linker have
already produced, so generator expressions, conditional links and helper
functions all arrive resolved.
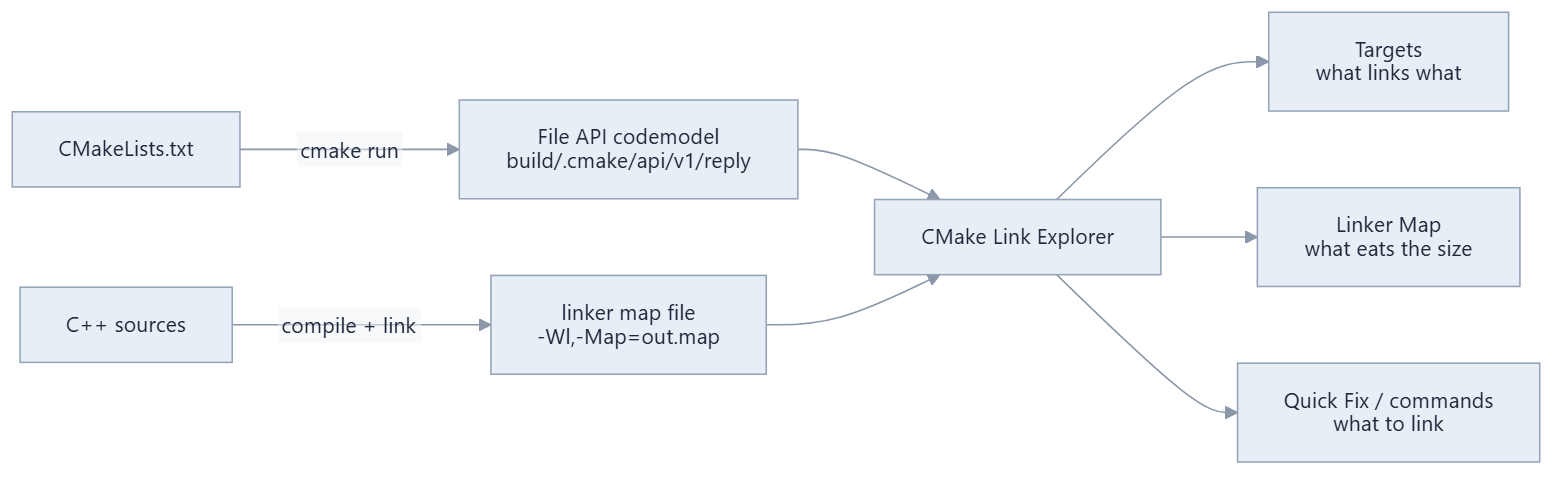
The codemodel carries targets, dependencies, macros, include paths and the
file:line each of them was written at. The map file carries what takes how
many bytes. ninja's build log carries what took how many milliseconds. Joining
them is what this extension does.
Nothing to build, no dependencies. It is plain JavaScript.
Grab cmake-link-explorer-<version>-windows.zip from
Releases, unzip it and
run install.cmd. It locates VS Code itself, so code does not have to be on
PATH — right after installing VS Code the terminal is usually still holding the
PATH it started with, and code is not there yet.
Grab the .vsix from
Releases and use
... → Install from VSIX in the Extensions view, or:
code --install-extension cmake-link-explorer-<version>.vsix
To build one yourself from the repository (needs Node; the extension itself still has no dependencies):
npx @vscode/vsce package
Easier if you intend to edit it: git pull and restart VS Code to pick changes up.
macOS / Linux
git clone https://github.com/Ruminem/cmake-link-explorer.git ~/cmake-link-explorer
mkdir -p ~/.vscode/extensions
ln -s ~/cmake-link-explorer ~/.vscode/extensions/cmake-link-explorer
Windows — symlinks can need elevation, so use a junction (/J).
git clone https://github.com/Ruminem/cmake-link-explorer.git C:\dev\cmake-link-explorer
mkdir "%USERPROFILE%\.vscode\extensions"
mklink /J "%USERPROFILE%\.vscode\extensions\cmake-link-explorer" "C:\dev\cmake-link-explorer"
Quit VS Code completely and start it again.
code --list-extensions | grep cmake-link          # macOS / Linux
code --list-extensions | Select-String cmake-link # Windows PowerShell
Ruminem.cmake-link-explorer means it is installed. It sits there like a theme or
an icon pack would, and the cloned folder does not have to be open in VS Code.
From then on it wakes up when you open a CMake project or a C/C++ file. There is no icon to press first.
The build directory is found by looking for CMakeCache.txt (three levels deep).
Map files are listed from whatever *.map sits in that build directory, and
ninja's .ninja_log is picked up from it automatically.
Open this repository in VS Code and press F5 for a window with the extension
loaded. That is the development loop; you do not need it to just use the thing.
The most frequent place to get stuck.
"I want to include this header and use the API in it, and I have no idea what to link where in CMakeLists.txt."
Put the cursor on an #include line and a lightbulb (Quick Fix) appears.
#include "log_wrapper.h" 💡 Link log_wrapper from store_testTake it and the right CMakeLists.txt gets edited.
target_link_libraries(store_test PRIVATE store_reader log_wrapper)
                                                      ^^^^^^^^^^^ added
An existing target_link_libraries call is extended; if there is none, a new one
goes in right after the target is declared. Other targets in the same file are
left alone.
An existing call is only extended when extending it is right. A library
appended to a call that sits inside if(WIN32) is linked on Windows and nowhere
else, and one appended after an INTERFACE keyword is not linked by the target
at all — both look like the fix worked. So when the call is inside a block, or
its last section is a different keyword than the one you need, a separate call
is written instead and the notification says why. If the existing call uses the
plain signature — no keyword — CMake refuses to mix the two forms, and you are
asked to add the line by hand rather than shown an edit that would not configure.
The keyword follows from where you included it.
| Where the include is | Keyword | Why |
|---|---|---|
.cpp |
PRIVATE |
nobody else sees it |
.h / .hpp |
PUBLIC |
it becomes this target's interface. Consumers read that header too, so the dependency has to travel with it |
| INTERFACE library | INTERFACE |
there is no other option |
Include from a header and link it PRIVATE and it compiles here and breaks in
the consumer. Same header: PRIVATE from a .cpp, PUBLIC from a .h.
| Verdict | Meaning |
|---|---|
| already-linked | linked directly. Go ahead |
| transitive | only reachable through another library. It compiles today and breaks the day that middle library stops using it |
| needs-link | no link at all. Here is the exact line to add |
| not-found | no target in this project provides it |
Calling out transitive separately is the whole point. It builds, so nobody
notices, until somebody else's commit breaks it.
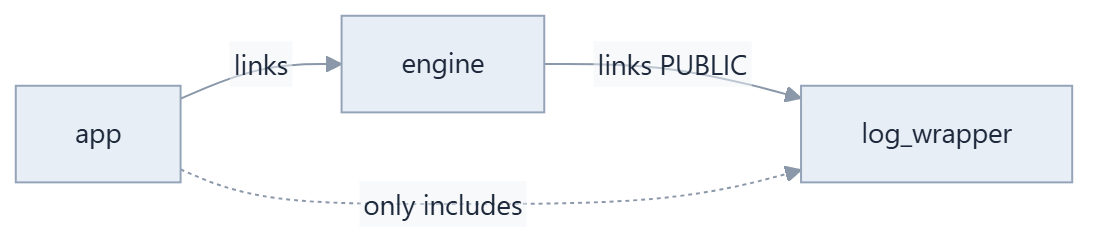
app does not link log_wrapper. It compiles today because engine drags it in
PUBLIC. The day somebody drops that link from engine, app breaks. The
person who changed it has no idea what they broke, and the person holding the
breakage has no idea why.
Turning the dotted line solid is what the transitive verdict asks for.
Header to target goes through three steps, reported in order of confidence.
- listed — the header is in the target's source list (CMake knows; certain)
- owned — the header is inside that target's source directory
- nearby — a file by that name is somewhere under the target's directory
Which target a file belongs to comes from CMake's source lists, read backwards.
Limit — header-only INTERFACE libraries do not appear as targets in the CMake
codemodel, so they cannot be found. abseil's absl::config and friends land
here. It says not-found rather than inventing something.
"Why is
#ifdef USE_HAL_DRIVERnot firing?" "Which include paths can this file even see?"
Run the command on a source file and out come the effective macros and include paths.
board.cpp
  target     board  [static]
  language   CXX (17)

  defines (4)   set by the build; #define in the source is not part of this
    BOARD_REV=3
    STM32F407xx
    USE_HAL_DRIVER
    NDEBUG   [from compile flags]

  include paths (2)
    /proj/board/inc
    /opt/sdk   [system]
No CMakeLists spells this out. Only BOARD_REV=3 is defined by board
itself; STM32F407xx and USE_HAL_DRIVER arrived through hal marking them
PUBLIC. CMake resolves generator expressions and PUBLIC/INTERFACE
inheritance before writing the codemodel, so what shows up here is what the
compiler actually receives.
Every -D counts, not just target_compile_definitions. A macro put in
CMAKE_CXX_FLAGS or target_compile_options() reaches the compiler exactly as
hard, but CMake reports it as a plain command fragment rather than a define, so
it is read out of there too and marked [from compile flags]. MSVC's /D is
read as well.
A #define in the source is not in this list and cannot be. CMake never
reads the file's contents — it only knows the command line it hands the
compiler. Macros written in the file, or picked up from a header, live a layer
below anything the build system can see.
Headers are compiled by nobody, so they are in no compile group. When the target has exactly one language group that is what including them means, so it is shown and marked as inferred; when C and C++ both sit in the target, nothing is picked. Choosing one would be inventing the answer.
TARGETS                            executables first, then by how many depend on it
🚀 sample_app     →3
📦 engine         →2 ←2            a hub, without expanding anything
📦 math_utils        ←2            a leaf that links nothing
📦 db_wrap           ←1

▾ 📦 engine       →2 ←2
     → math_utils      static      blue arrow = what it links
     → store_reader    static  →1
     ← engine_test     exe         orange arrow = what links it
     ← sample_app      exe
One row carries both directions.
- only
→= top of the tree, nothing uses it (usually an executable) - only
←= a leaf library, the dangerous kind to break - both large = a hub in the middle
Expanding shows both directions at once, with no folder to go through first. Keep expanding a child and it follows the chain in that direction only.
Open a map file in the Linker Map view and the same row gains how much of the binary that target occupies.
🚀 sample_app     →3        111 B
📦 engine         →2 ←2      44 B
📦 store_reader   →1 ←2     1.0 KB
📦 db_wrap           ←1      277 B
📦 log_wrapper       ←1       49 B
📦 math_utils        ←2               not in this image
📚 render_core    →1 ←1     dynamic
The nameOnDisk CMake reports (libstore_reader.a) is matched against the names
in the map. Executables are found through CMake's rule of putting objects in
<target>.dir/.
Two questions then sit on one line.
store_reader— 1.0 KB for something only two targets use. A candidate for cleanupmath_utils— two targets use it and it is not in the image.render_coreis a shared library, so the symbols resolved there instead. You do not learn this without reading the maprender_core— dynamically linked, so it is not in the image. Reporting the few dozen bytes of import stubs as its size would be off by orders of magnitude, so it just saysdynamic
Set sortTargets to size and "heavy for how little uses it" sorts to the
top. That is the first move when putting a binary on a diet.
It does not parse CMakeLists.txt. It uses CMake's File API (3.14+).
Drop a query file in the build directory and CMake writes the fully resolved
target graph as JSON into .cmake/api/v1/reply/ on the next configure. No need
to interpret generator expressions or conditional links yourself.
That reply is written when CMake configures, and nothing rewrites it when you
edit a CMakeLists.txt. Delete a target_link_libraries() line and the answer
to Which Library Provides This Include? is still "already links it" — correct
about the last configure, wrong about the file in front of you, and it looks
exactly like a right answer.
So every command compares the reply against the CMakeLists.txt files it was
built from, and says so before answering:
example/CMakeLists.txtchanged since CMake last configured, so the answer for this include describes the previous configure. [Run CMake configure] [Show it anyway]
The status bar carries the same warning, and the tooltip names the edited files.
A timestamp alone would fire on Ctrl+S over a buffer nobody changed, so when
the reply and the files agree the contents are recorded, and a file that is
newer has to differ from that record to count as an edit.
An open CMakeLists.txt with unsaved changes counts too, and no timestamp
says so — CMake reads files, not buffers. Run CMake configure saves those
first, and applying a link edit writes it through to disk, so the configure
offered next to it regenerates from the line just written rather than from the
text without it.
The status bar tracks this live: editing, saving or reverting a CMakeLists.txt
moves it without waiting for anything to reload the model.
The File API's dependencies is the transitive closure in build order. It
lists every library an executable ends up linking, so shown as-is, a target with
three lines of target_link_libraries looks like it links fifty.
So it is reduced to the minimum set of edges that preserves reachability.
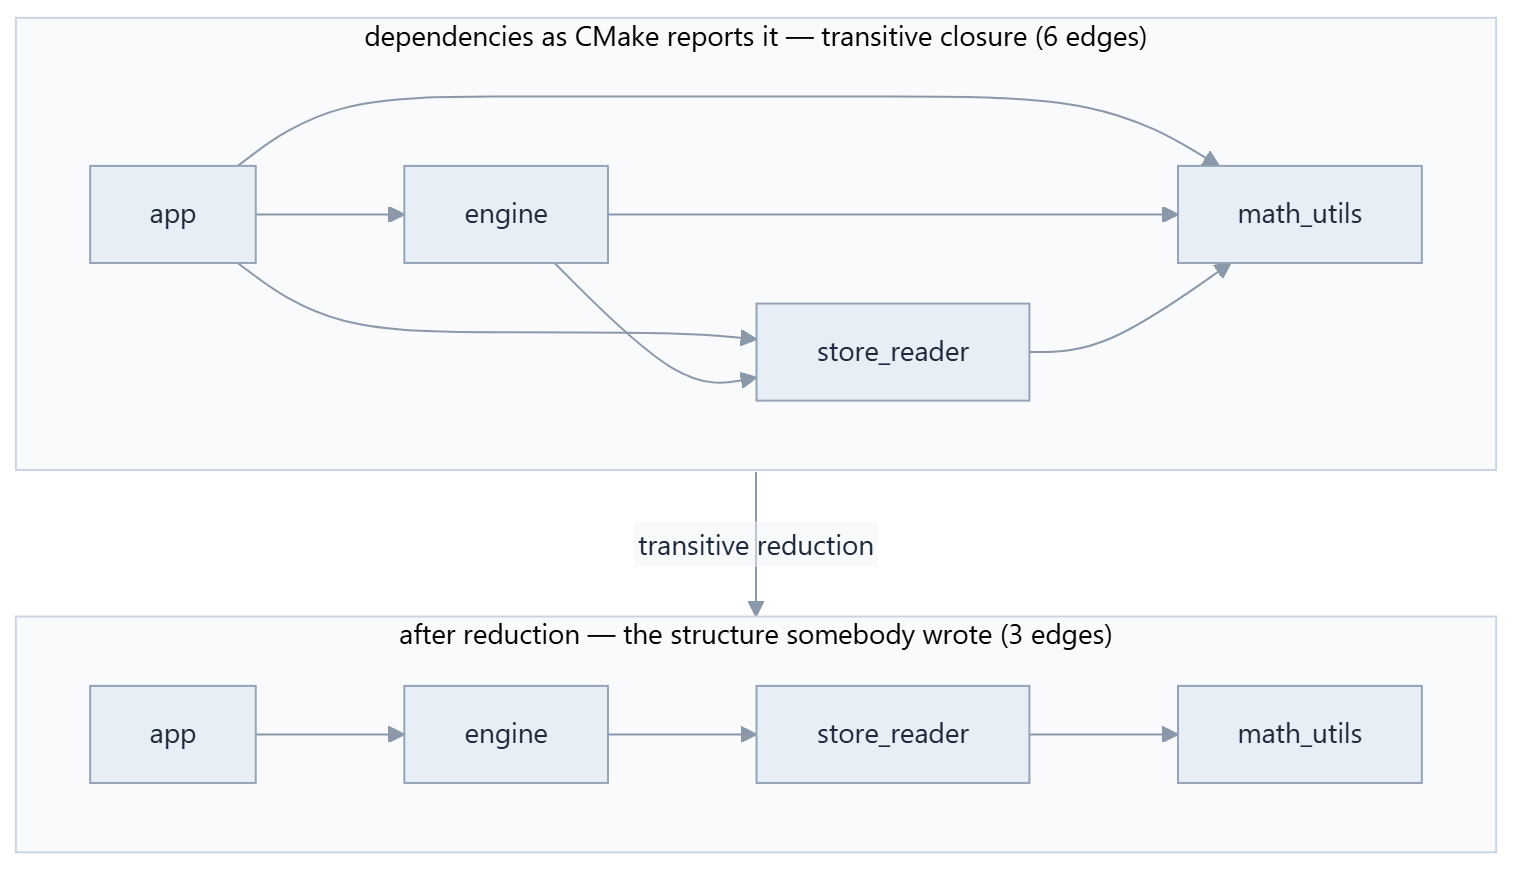
Six edges became three and every reachable relationship survived. There is
still a path from app to math_utils. Measured on abseil-cpp, 121 targets:
| edges CMake reported | 1,405 |
| after reduction | 134 (90% fewer) |
the log_flags target |
50 → 3 |
Careful — the reduced graph is "the minimal shape of the link structure", not
"the list written in target_link_libraries".
- if A explicitly links B and C, and B also links C, the
A → Cedge disappears - header-only INTERFACE libraries are not targets in the CMake codemodel, so they never show up at all (common in projects like abseil)
Turn on showTransitiveDependencies for the full picture. The tooltip always
carries both counts as links: 3 (50 including transitive).
→n ←non the row — both counts without expanding- sorted by structure by default (executables, then by how many depend on it).
sortTargetsswitches to alphabetical external— libraries from outside the project, grouped at the bottom- click a target to jump to the line it was declared on, read from CMake's
backtraceGraph - Find Target — by name
- Why Is This Linked? — traces the shortest dependency path between two
targets one hop at a time, each hop carrying the
file:lineof thetarget_link_librariesthat made it - refreshes itself when CMake reconfigures
Look for a target by searching for add_library(<name> and you find nothing the
moment the name is a variable or the call sits inside a helper function. Both are
ordinary in real projects.
function(add_module name)
  add_library(${name} ${name}.cpp)     # the actual add_library
endfunction()

add_module(sensor)                     # the line somebody wrote
Searching for sensor turns up nothing. CMake knows, so it is read from
backtraceGraph instead. The cursor lands on the line somebody wrote, and
when a helper stands in between, the status bar says where the add_library
really ran. The old text search is the fallback for a codemodel that gives no
location.
Two things a link graph can answer about itself.
cycles (1)
    a → b → c → a
      a links b    libs/a/CMakeLists.txt:6
      b links c    libs/b/CMakeLists.txt:4
      c links a    libs/c/CMakeLists.txt:5

unused libraries (1)
    legacy_parser  [static]    libs/legacy_parser/CMakeLists.txt:1
CMake allows cycles between static libraries. It resolves them by repeating the archives on the link line, so they configure and build. That is exactly why they go unnoticed.
The catch is that the File API's dependencies is a build order. An order
cannot loop, so CMake drops the edge that closes the cycle. c links a and
c.dependencies still comes back empty.
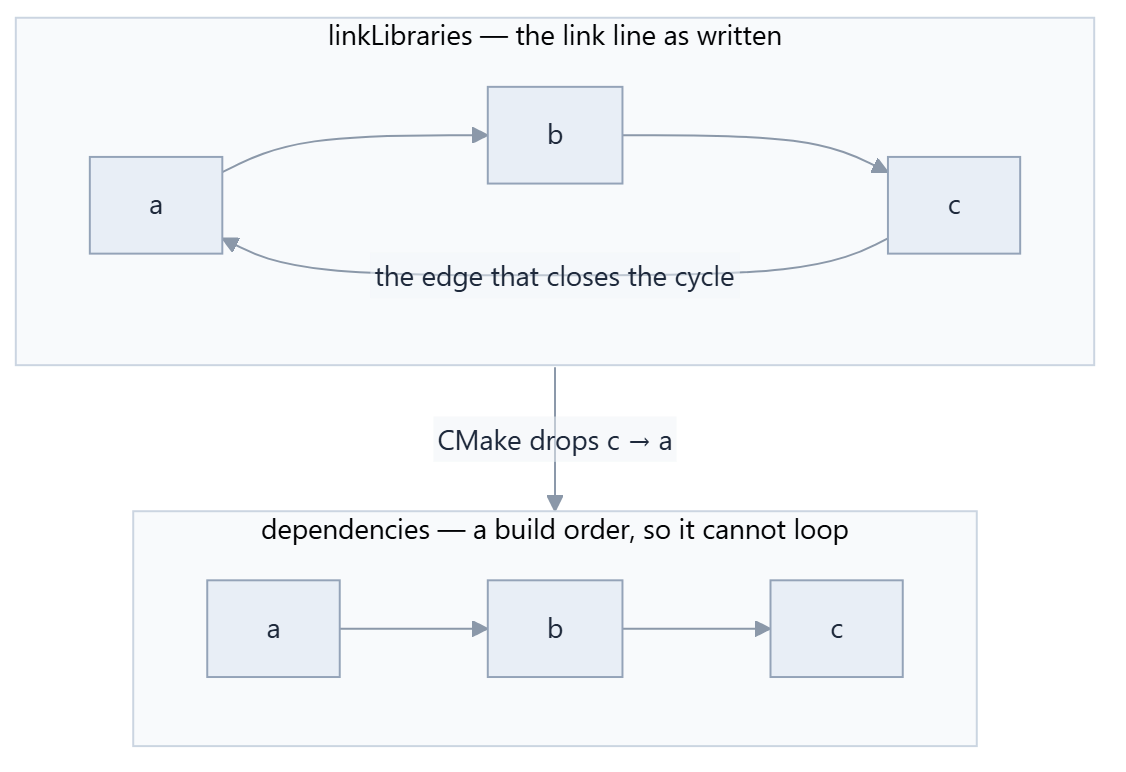
Look at the top only and there is a cycle; look at the bottom only and it is an ordinary chain.
So this check reads linkLibraries, the link list as written. An older codemodel
has no such field, and there it says "cannot tell" rather than "none". You do
not get to call something absent when you cannot see it. (A project with no edges
at all is the exception: nothing can close a loop, so that answers "none".)
Not everything nobody links is dead weight.
| Excluded | Why |
|---|---|
| executables | they are entry points. Nothing linking them is normal |
install()ed libraries |
that is the deliverable, built for somebody outside |
| MODULE libraries | plugins, reached by dlopen rather than by linking |
| UTILITY targets | never a link target in the first place |
The same CMakeLists.txt configures differently on different platforms. If
day-to-day development happens on Windows and the product is built on Linux, that
difference is usually what "builds here, breaks there" turns out to be. Put the
two build trees side by side.
this tree   C:/proj/out/build/x64-Debug
other tree  /mnt/linux/proj/build

only in this tree (1)
    win_shim  [static]    src/win/CMakeLists.txt:3

only in the other tree (1)
    posix_shim  [static]  src/posix/CMakeLists.txt:3

differing targets (1)
  "-" is only in this tree, "+" only in the other.

  core
    define    - USE_IOCP
    define    + USE_EPOLL
    include   - src/win
    include   + src/posix
    links     - win_shim
    links     + posix_shim
The same project has completely different path prefixes on two machines. Compare
C:/work/proj/src against /home/me/proj/src as strings and every include
reads as changed, which buries the signal.
So each path is taken relative to its own tree's source root — both of those
become src. Separators (\ vs /) are settled too, and case is ignored: one
side is usually Windows, where CMake can record a casing the checkout does not
have.
| Excluded | Why |
|---|---|
| include paths outside the project | C:/SDK/include against /opt/sdk/include says where somebody installed an SDK |
| external libraries | the same dependency is ws2_32.lib on one side and -lz on the other |
Both fire on every target and drown the differences worth seeing.
LINKER MAP  democore.map          gnu-ld · 21.8 KB
├── memory regions
│   ├── FLASH        3.6 KB / 512.0 KB    0.71%
│   └── RAM         18.0 KB / 128.0 KB     14.1%
├── by object                              21.8 KB total
│   ├── store_reader.o  (libdemocore.a)   17.5 KB   80.2%
│   │   ├── .bss                          16.0 KB   91.5%
│   │   └── .text                          1.5 KB    8.4%
│   └── app.o                              2.4 KB   10.8%
├── by section
├── largest symbols
└── why archive members were pulled in
    └── math_utils.o        ← app.o  (math_project)
| How to produce one | Status | |
|---|---|---|
| GNU ld | -Wl,-Map=out.map |
verified against real arm-none-eabi-ld output |
| Apple ld64 | -Wl,-map,out.map |
verified against real Xcode linker output |
| LLVM lld | --Map= |
unsupported |
lld is left out on purpose. Guessing at a format without a real sample means quietly showing wrong numbers. It goes in when there is a sample to check against.
The format is detected from the file's content. Anything that is not a map file is rejected rather than misread.
- wrapped section names — GNU ld pushes the address and size onto the next
line when the name is too long.
.text.engine_loadand everything like it qualifies, and missing this drops a large part of a real embedded map - archive members —
libfoo.a(bar.o)split into archive and object - the
Archive member includedtable — why each archive member was pulled in, and by which object referencing which symbol. The linker-level answer to the same question the Targets view's "Why Is This Linked?" asks Discarded input sections— what--gc-sectionscut. Kept out of the image total but shown separately- memory regions — the
Memory Configurationtable, turned into FLASH/RAM usage. Placement follows the address, so a.datawhose LMA alone is in FLASH viaAT>counts against RAM - symbols against linker script assignments — a line like
. = ALIGN(4)is not a symbol
Symbols in a map file are mangled, which makes the symbol list unreadable on
exactly the C++ projects where it matters most. They go through c++filt in one
pass.
__ZNSt3__111__introsortINS_17_ClassicAlgPolicyERNS_6__lessIvEE...
  ↓
std::__1::__introsort<std::__1::_ClassicAlgPolicy, ...>(...)
Point demanglerCommand elsewhere for a different toolchain
(arm-none-eabi-c++filt and so on).
With no c++filt around, a built-in demangler takes over. Windows usually has
none (Git for Windows does not bundle one either) while the maps come off a Linux
build, so there it is the normal path rather than a fallback.
The built-in one handles only the shapes worth reading: namespaced functions, member functions, constructors and destructors, operators, builtin types with pointers and references, and back-references. Templates and ABI tags are declined on purpose and keep their mangled name.
__ZN11log_wrapper3LogEPKcS1_   →  log_wrapper::Log(char const*, char const*)
__ZN4TileaSERKS_               →  Tile::operator=(Tile const&)
__ZNKSt3__110unique_ptrINS_... →  (left alone)
Declining costs nothing, which the checked-in maps show if you count: of 503 mangled symbols, 489 are libc++ internals whose demangled form is a 200-character template nobody reads. The 14 that get read are all inside the subset above. Better to leave the rest mangled than to guess and quietly print a wrong name — the same reason lld's map format is not in yet.
Compare Two Map Files puts two builds side by side: what grew and shrank per object and per section, sorted by how much it moved. Unchanged rows are left out.
DIFF
├── total          44.1 KB → 13.5 KB   -30.5 KB
├── by object
└── by section
    ├── __text     -28.4 KB    40.2 KB → 11.8 KB
    └── __got        -288 B       648 B → 360 B
The same question from the other side. The map says what is eating the size; this says what is eating the time.
It opens by itself. ninja keeps its log at .ninja_log in the build
directory, which is the directory this extension is already pointed at, so
there is nothing to go and find. Build once and the view is populated.
Only the Ninja generator writes one. A Visual Studio or Makefiles tree has
no equivalent, and nothing here invents one — the view stays empty and says so.
Configure with -G Ninja if you want it.
BUILD TIME                                        build  ·  390 ms  ·  18 steps
├── last build            390 ms   ·   11.6 s of work across 18 steps
├── by target                                                   9 attributed
│   ├── math_utils        3.2 s   27.1%
│   │   ├── .../math_utils/libmath_utils.a           3.0 s   25.5%
│   │   └── .../math_utils.dir/math_utils.cpp.obj    184 ms   1.58%
│   ├── db_wrap           3.2 s   27.1%
│   └── log_wrapper       3.1 s   27.0%
├── slowest steps                                                        18
├── by kind of work
│   ├── archiving         8.8 s   75.9%
│   ├── compiling         2.1 s   18.4%
│   └── linking           669 ms   5.74%
└── builds in this log                                     2, newest first
That first row is two numbers because they answer different questions. 390 ms is what you waited for; 11.6 s is what the machine did, added up. They differ by however many jobs ran at once, and only the first one is the build getting faster.
The example is also the sort of thing the view is for: three quarters of this
build is ar, not the compiler.
Five tab-separated columns per completed step, in milliseconds since that ninja invocation started:
# ninja log v7
10   194   8104820215628786   libs/.../math_utils.cpp.obj   665c63a0cbc75772
^     ^    ^                  ^                             ^
start end  mtime              output                        command hash
Three things about that file are easy to get wrong, and all three were found by building a project and reading the result rather than by reading the docs.
One step can have several outputs. A DLL and its import library are one link, written as two lines with identical timings:
3167  3325  8104820248661472  libs/render_core/librender_core.dll     8d49...
3167  3325  8104820248661472  libs/render_core/librender_core.dll.a   8d49...
Adding up per output bills that link twice. Everything here counts steps, not
outputs, and the row says (+1) when a step produced more than one file.
ninja appends and never clears. Build again and the rebuilt outputs get a
second line. The last line for an output is the current answer — in the
fixture engine.cpp.obj is 203 ms cold and 90 ms warm, and reporting the first
would describe a compile that no longer happens that way.
Taking the last line per output rather than the last build is what makes the view useful: after one full build and any number of small incremental ones, every target still has a time.
One file holds several builds. There is no marker between runs. The only
signal is that the end column drops back towards zero, because ninja writes
each line as its step finishes.
The log knows libs/engine/CMakeFiles/engine.dir/engine.cpp.obj took 90 ms.
CMake knows that path belongs to target engine. Three routes, most specific
first: CMake's <target>.dir/ layout, an output named exactly like the
target's nameOnDisk, and — only once both have missed — the same stem, so a
log from a Linux build still joins to a tree configured on Windows
(libengine.a there, engine.lib here). This is the join the linker map
already does, and it reuses the same stem rule.
Object files are never matched by stem: they keep their own names across
platforms, so app.cpp.obj would be credited to a target called app instead
of to the directory it was compiled in.
Once a log is open, every target in the Targets view carries its build time,
and sortTargets: time orders by it.
Compare Two Build Logs puts two builds side by side, sorted by how much each step moved. Unchanged steps are left out.
DIFF
├── total work     11.8 s → 11.6 s   -136 ms
└── by step
    ├── .../engine.dir/engine.cpp.obj   -113 ms     203 ms → 90 ms
    └── .../libs/engine/libengine.a       -11 ms     138 ms → 127 ms
| Key | Default | Description |
|---|---|---|
cmakeLinkExplorer.buildDirectory |
"" |
Build directory. Empty means auto-detect |
cmakeLinkExplorer.configuration |
"" |
Which configuration to show in a multi-config generator (Debug/Release) |
cmakeLinkExplorer.showUtilityTargets |
false |
Show UTILITY targets |
cmakeLinkExplorer.showExternalLibraries |
true |
Show external libraries |
cmakeLinkExplorer.showTransitiveDependencies |
false |
Show the full closure instead of reducing it |
cmakeLinkExplorer.sortTargets |
structure |
structure = executables first, then by how many depend on it / size = by contribution to the image (needs a map) / time = by how long it takes to build (needs a build log) / name = alphabetical |
cmakeLinkExplorer.demangleSymbols |
true |
Demangle C++ symbols |
cmakeLinkExplorer.demanglerCommand |
c++filt |
Which demangler to use |
cmakeLinkExplorer.mapSymbolLimit |
200 |
Most symbols to show |
cmakeLinkExplorer.slowestEdgeLimit |
50 |
Most build steps to list |
Build the generated inputs first (test/fixture/ and
test/sample-project/build/ are not committed):
./test/bootstrap.sh
Windows has no sh, so call what it does directly. The synthetic fixture needs
only Python; the real build tree part only means anything with cmake installed.
python test\make-fixture.py
python, not python3. On Windows python3 usually reaches a Microsoft Store
stub rather than an interpreter.
Then:
node test/run.js                                  synthetic File API fixture
node test/run.js $PWD/test/sample-project/build   a real CMake build tree
node test/run.js /path/to/any/build               any CMake project
node test/tree-test.js                            target tree rendering
node test/map-test.js                             map parser + map tree
node test/map-test.js /path/to/x.map              take one map file apart
node test/include-test.js                         include -> link resolution + CMakeLists editing
node test/time-test.js                            build log parser + build time tree
node test/time-test.js /path/to/.ninja_log        take one build log apart
Inside a real VS Code extension host (activation, command registration, the tree, editor jumps, the map view, the build time view):
macOS
CMAKE_LINK_TEST_LOG=/tmp/it.log \
"/Applications/Visual Studio Code.app/Contents/MacOS/Code" \
  --user-data-dir=/tmp/clx-ud --extensions-dir=/tmp/clx-ext \
  --extensionDevelopmentPath="$PWD" \
  --extensionTestsPath="$PWD/test/integration" \
  --disable-extensions "$PWD/test/sample-project"
cat /tmp/it.log
Windows (PowerShell)
$env:CMAKE_LINK_TEST_LOG = "$env:TEMP\it.log"
& "$env:LOCALAPPDATA\Programs\Microsoft VS Code\Code.exe" `
  --user-data-dir="$env:TEMP\clx-ud" --extensions-dir="$env:TEMP\clx-ext" `
  --extensionDevelopmentPath="$PWD" `
  --extensionTestsPath="$PWD\test\integration" `
  --disable-extensions "$PWD\test\sample-project"
Get-Content "$env:TEMP\it.log"
The extension host does not hand logs back over stdout, so CMAKE_LINK_TEST_LOG
catches them.
Giving it a separate profile through --user-data-dir and --extensions-dir
matters. Without them, an already-running VS Code makes it refuse with
Running extension tests from the command line is currently only supported if no other instance of Code is running. With them you keep working in your usual
window.
The map files in test/maps/ are real linker output and are checked in, so the
tests run with no toolchain installed. Regenerate them with
test/mapgen/generate.sh (the GNU ld half needs
brew install arm-none-eabi-binutils).
| Against | |
|---|---|
| synthetic File API fixture + backtraces + cycles/unused + tree comparison + staleness | 61 checks |
test/sample-project (real CMake 4.4) |
18 checks |
| googletest / abseil-cpp (121 targets) | 8 checks |
| target tree rendering | 18 checks |
| map parser + map tree + target join + demangler | 64 checks |
| build log parser + build time tree + target join (real ninja output) | 40 checks |
| include → link resolution + CMakeLists editing + compile settings | 56 checks |
| VS Code extension host (1.136, macOS + Windows) | 47 checks |
Measured on a large project (2,000 targets, 812,728 dependency edges as CMake reported them) with an 8,000 line CMakeLists.txt.
| Before | Now | |
|---|---|---|
loadModel (including transitive reduction) |
2,161 ms | 265 ms |
findCommand (a target late in the file) |
1,794 ms | 3 ms |
| demangling 200,000 symbols | 1,014 ms | ~13 ms |
Include resolution also went from walking directories per target to indexing the source tree once. At 2,000 targets, 50 lookups of a header that is not there went from 174 ms to 3 ms.
The main changes:
- transitive reduction — instead of walking the graph per dependency pair, word-wise OR over bitmaps of target indexes. The set CMake hands over is already a closure, so no graph traversal is needed at all
- CMakeLists parsing — "is this position inside a string" used to count from the start of the file every time; now it is an index of quote positions and a binary search. O(n²) → O(n log n)
- demangling — only the top symbols actually on screen, not the whole map.
c++filtis a synchronous call, and handing it everything freezes the extension host for about a second - header lookup — the source tree is indexed once and cached instead of walking directories per target. Rebuilt only on a miss, and only when the index is stale (for the write-a-header-then-include-it flow)
- sorting —
localeComparebuilds a collator on every call. One sharedIntl.Collatortook sorting 2,000 targets from 18 ms to 5 ms - tooltips — built on hover through
resolveTreeItemrather than eagerly for every row
Caught while measuring.
- path case — Windows and the default macOS volume are case-insensitive, and VS Code can hand back a different casing than CMake recorded (a drive letter alone is enough). Compared literally, it fails to find which target a file belongs to and the feature dies entirely. On case-insensitive filesystems the comparison ignores case
- symbol attribution — symbols a linker script defines at an output section
boundary (
_bss_startand the like) were attaching to an unrelated object in the preceding section. Reset per output section now, so those honestly report that they belong to nothing - map size — the file was read whole with no size check. Past V8's string
limit a
RangeErrorsurfaces from deep inside the runtime. Over 256 MB it is refused with a reason - neighbour list cache key — the cache left settings out of its key, so it
returned stale results unless
refresh()had been called first
- LLVM lld map format (when a real sample turns up)
- MSVC
link.exe /MAPformat (likewise, when a real sample turns up) - graph view (webview with draggable nodes)
MIT. See LICENSE.
Not affiliated with, endorsed by, or sponsored by Kitware, Inc. CMake is a trademark of Kitware, Inc., used here only to say what this extension works with. Visual Studio Code is a product of Microsoft Corporation.