Repository navigation
Conversation


…e functions

perf-panel.js reads the agent's GET /api/local-model/performance answer
(issue AtomicBot-ai#996): a summary of generation and prompt speed, time to first
token, workers sharing the GPU and context used; two small SVG charts
that break around missing values and mark a model change; the pane's
states; and the 2 s poll, one request at a time, with a generation
counter so an answer from before a leave, re-entry or agent restart
is dropped.

Co-Authored-By: Claude Opus 5.5 <noreply@anthropic.com>
AgentClient.localPerformance() reads GET /api/local-model/performance
with a 5 s timeout and answers the status instead of throwing; main's
agent:localPerformance turns that into ok / unsupported (404, an agent
from before the route) / unreachable, and preload exposes it as
BR.localPerformance (issue AtomicBot-ai#996).

Co-Authored-By: Claude Opus 5.5 <noreply@anthropic.com>
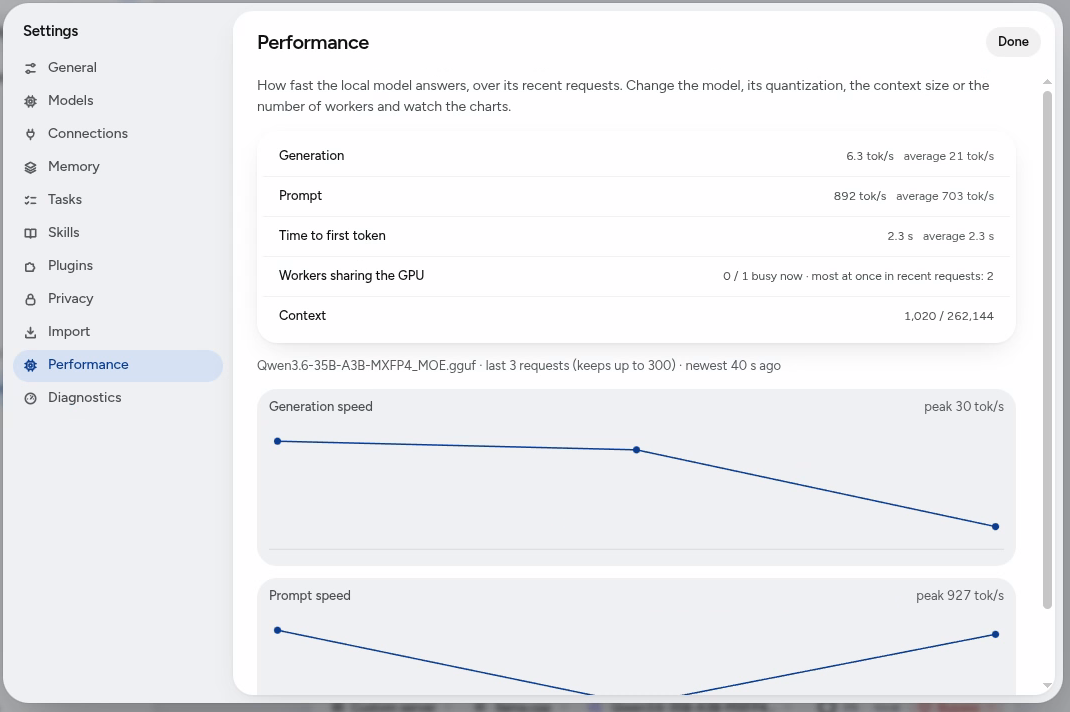
A Performance section just before Diagnostics draws perf-panel.js's
pane: generation and prompt speed (last and average), time to first
token, workers sharing the GPU, context used, and a chart of each
speed over the recent requests (issue AtomicBot-ai#996). The poll follows the pane
from render(): it starts when the pane comes on screen, stops when
Settings closes or moves on, and an agent restart makes any answer
already on its way stale. The --smoke settings check lists the new
pane.

Co-Authored-By: Claude Opus 5.5 <noreply@anthropic.com>
Co-Authored-By: Claude Opus 5.5 <noreply@anthropic.com>
… coordinates

Entering, leaving and re-entering the pane, or an agent restart, while a
request was still out sent another one alongside it. A newer generation
now waits for the request already out to settle and then asks; the stale
answer is still dropped. A chart size outside 1..10000 falls back to the
default, so no coordinate can overflow.
Keeping one request out at a time meant a request that never settled
held the pane on "loading" for good, even across leaving and re-entering
it. Past 15 s (the agent call itself times out at 5 s) the poll gives it
up: the pane says the agent is not answering, a fresh request goes out,
and the stuck one's late answer is dropped without freeing the newer
request's turn.

…m a live run

Seen in the running app against a real llama.cpp server:

- Time to first token showed "—" after every turn. The agent's own side
  requests (titles, memory) are not streamed, so they have no first-token
  time, and they land after the reply. The row now shows the newest
  streamed request's time, which is the wait the person had.
- The peak label was drawn inside the SVG, where it scaled with the
  chart's width and sat on the line when the first point was the peak.
  It is now in the caption, in the window's own font.

Author
|
Tried it in the running window (Linux, against a llama.cpp server on another machine on the LAN):
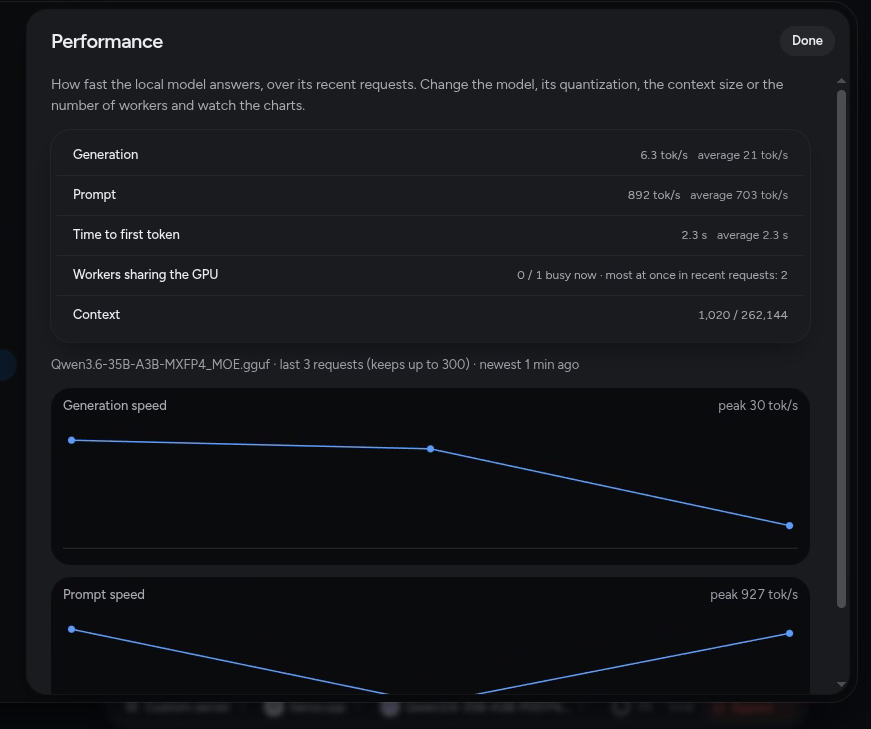
The same pane in the dark theme. The charts draw in the theme's own colours:
That run turned up two things, fixed in the last commit (661734c):
Both have regression tests. The low newest generation speed in the screenshot (6.3 tok/s) is one of those short side requests. The chart shows it as the last point. |
sheepdogs
added a commit
to sheepdogs/atomic-agent
that referenced
this pull request
Nov 10, 2026
This branch has not been deployed
This file contains hidden or bidirectional Unicode text that may be interpreted or compiled differently than what appears below. To review, open the file in an editor that reveals hidden Unicode characters.
Learn more about bidirectional Unicode characters
Sign up for free
to join this conversation on GitHub.
Already have an account?
Sign in to comment

Add this suggestion to a batch that can be applied as a single commit.This suggestion is invalid because no changes were made to the code.Suggestions cannot be applied while the pull request is closed.Suggestions cannot be applied while viewing a subset of changes.Only one suggestion per line can be applied in a batch.Add this suggestion to a batch that can be applied as a single commit.Applying suggestions on deleted lines is not supported.You must change the existing code in this line in order to create a valid suggestion.Outdated suggestions cannot be applied.This suggestion has been applied or marked resolved.Suggestions cannot be applied from pending reviews.Suggestions cannot be applied on multi-line comments.Suggestions cannot be applied while the pull request is queued to merge.Suggestion cannot be applied right now. Please check back later.
Closes #996 together with #1119 (agent, against
main), which adds the route this pane reads (GET /api/local-model/performance). Against an older agent the pane says so and draws nothing.What
Settings › Performance, just before Diagnostics. While the pane is on screen it asks the agent every 2 s and shows:
busy / totalfrom the server's slots right now, plus the most requests the agent had open at once in recent requests.Edge states, each with its own sentence:
How
renderer/perf-panel.js(new, declares only, likefusion-panel.js):perfEscfor every string (the model name comes from the model server);render().agent:localPerformancealways answers one of{ok:true,data}/{kind:'unsupported'}(404) /{kind:'unreachable',error}— never a throw into the window (main/local-performance.ts).css/perf.cssuses the theme's variables only.performanceis added to the smoke check's pane list inmain.ts.Checks
npm run lint: clean.tsc+ copy-renderer): clean.npm run test:unit: 1437 / 1437 pass (+44 tests).NaN/Infinity/undefined.Left alone
Analytics checks pane names against
SETTINGS_PANES, which lists neitherperformancenor the existingplugins, so views of both fall back the same way. Happy to add both if you want them counted.AI assistance
Developed with AI assistance (Claude Code built it to a written spec; an independent Codex review ran three rounds before this PR) under my direction. I reviewed the diff, re-ran every check above myself, and ran it against a real llama.cpp server.