


Photometric polar diagram generator for EULUMDAT (.ldt) files —
designed for product datasheets and publication-ready documents.
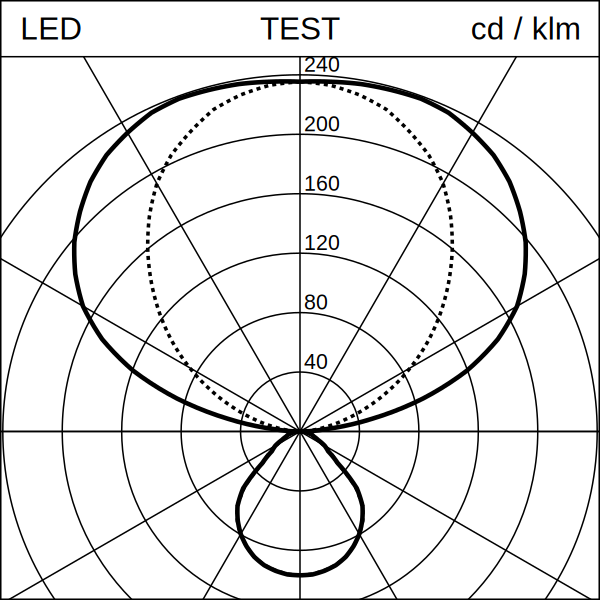
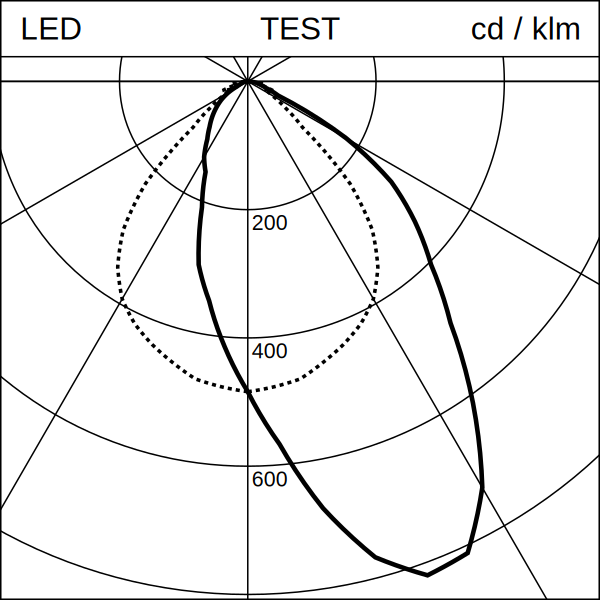
Reads a .ldt file and produces a Lumtopic-style SVG: a square image
with a top banner and a polar candela distribution diagram showing the
C0/C180 (solid) and C90/C270 (dotted) curves, scaled to fill the plot area.
For scientific / interactive plots (matplotlib, axis labels, legends), see the eulumdat-py examples.
Part of the eulumdat-* ecosystem, built
on top of eulumdat-py.
- Reads any EULUMDAT file — all symmetry types (ISYM 0–4) handled by
eulumdat-py - Generates a publication-ready SVG polar diagram (Lumtopic style)
- Dynamic radial scale (3–6 concentric circles, round values)
- Dominant-hemisphere detection for automatic scale label placement
- Proportional scaling via
Layout.for_size(n)— one parameter controls everything - Optional I(γ) interpolation (linear or cubic spline) for smooth curves
- Optional raster export to PNG and JPEG (cross-platform, no native DLL)
- Debug mode for visual validation of C-plane assignment
Core package (SVG generation only):
pip install eulumdat-plotWith raster export (PNG / JPEG):
pip install "eulumdat-plot[export]"With cubic spline interpolation:
pip install "eulumdat-plot[cubic]"Everything:
pip install "eulumdat-plot[full]"from eulumdat_plot import plot_ldt
# Generate an SVG next to the source file
svg = plot_ldt("luminaire.ldt")
# With a distribution code in the banner centre
svg = plot_ldt("luminaire.ldt", code="D53")All visual parameters (stroke widths, font sizes, margins) scale proportionally from the 1181 px reference with a single call:
from eulumdat_plot import plot_ldt, Layout

svg = plot_ldt("luminaire.ldt", layout=Layout.for_size(600))from eulumdat_plot import plot_ldt, Layout
from eulumdat_plot.export import svg_to_png, svg_to_jpg
svg = plot_ldt("luminaire.ldt", layout=Layout.for_size(1181))
png = svg_to_png(svg, size_px=600)
jpg = svg_to_jpg(svg, size_px=600, quality=95)The export size is independent of the SVG canvas size.
def plot_ldt(
    ldt_path: str | Path,
    svg_path: str | Path | None = None,
    *,
    code: str = "",
    layout: Layout | None = None,
    interpolate: bool = True,
    interp_step_deg: float = 1.0,
    interp_method: str = "linear",
    debug: bool = False,
) -> Path| Parameter | Default | Description |
|---|---|---|
ldt_path |
— | Source .ldt file |
svg_path |
same name, .svg |
Output SVG path |
code |
"" |
Distribution code shown in the banner centre |
layout |
Layout() |
Visual parameters |
interpolate |
True |
Resample I(γ) before plotting |
interp_step_deg |
1.0 |
Angular step for resampling (degrees) |
interp_method |
"linear" |
"linear" or "cubic" (requires scipy) |
debug |
False |
Colour-code C-planes for visual validation |
Layout.for_size(size_px: int) -> LayoutCreates a Layout with all dimensions scaled proportionally from the
1181 px reference. Layout.for_size(1181) is identical to Layout().
svg_to_png(svg_path, png_path=None, *, size_px=1181, background="#FFFFFF") -> Path
svg_to_jpg(svg_path, jpg_path=None, *, size_px=1181, background="#FFFFFF", quality=95) -> Path
Requires pip install "eulumdat-plot[export]".
| File | Description |
|---|---|
examples/01_basic_usage.md |
Generate an SVG from a .ldt file |
examples/02_resize_and_export.md |
Scaling, raster export, batch processing |
eulumdat-plot/
├── data/
│   ├── input/          # sample .ldt files (ISYM 0–4)
│   └── output/         # generated SVG / PNG / JPEG
├── docs/
│   └── img/
│       └── sample_01.svg
├── examples/
│   ├── 01_basic_usage.md
│   └── 02_resize_and_export.md
├── src/
│   └── eulumdat_plot/
│       ├── __init__.py
│       ├── plot.py     # public API — LDT → SVG pipeline
│       ├── renderer.py # SVG renderer + Layout dataclass
│       └── export.py   # raster export (PNG / JPEG)
├── tests/
│   ├── test_smoke.py   # 46 real LDT files, all ISYM types
│   └── test_scaling.py # Layout.for_size() proportionality
├── pyproject.toml
├── CHANGELOG.md
└── README.md
| Package | Status | Description |
|---|---|---|
eulumdat-py |
v0.1.4 | Read / write EULUMDAT files |
eulumdat-symmetry |
v1.0.0 | Symmetrise EULUMDAT files |
eulumdat-plot |
v1.0.0 | Photometric polar diagram — this package |
eulumdat-luminance |
planned | Luminance table cd/m² (γ 55°–85°) |
eulumdat-ugr |
planned | UGR calculation (CIE 117, CIE 190) |
- Python ≥ 3.9
eulumdat-py≥ 1.0.0numpy≥ 1.21svgwrite≥ 1.4- (optional)
vl-convert-python≥ 1.6 +Pillow≥ 9.0 — raster export - (optional)
scipy≥ 1.7 — cubic spline interpolation
MIT — © 2024 123VincentB