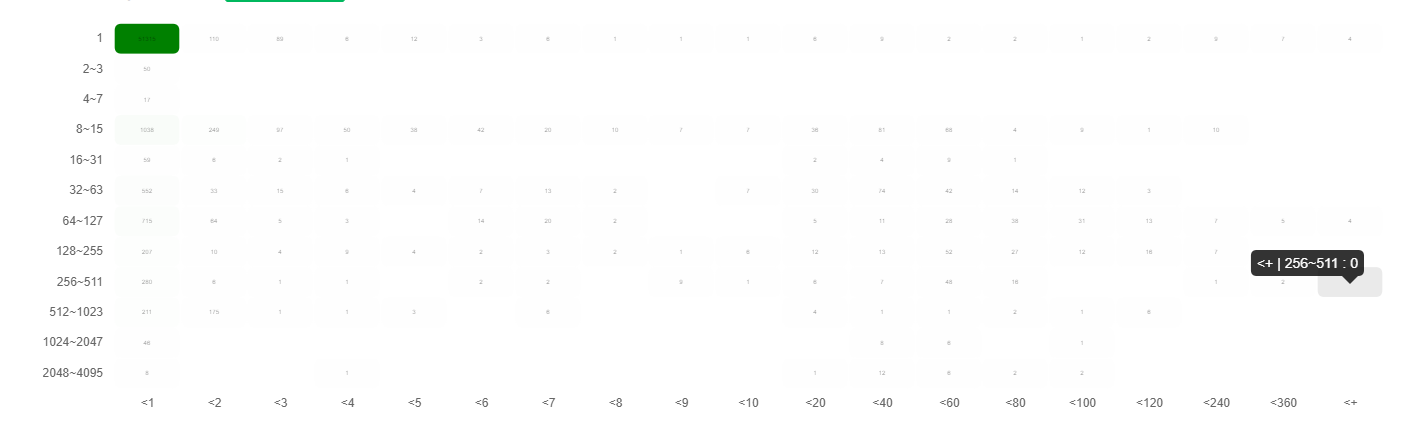
I configured the source as shown below, but I do not see the scaleLabel.
Could you explain it?
var newChart = new Chart(ctx).HeatMap(data, {
responsive: true,
maintainAspectRatio: false,
colors: [
'rgba(255, 255, 255, 1.0)'
,'rgba(0, 128, 0, 1.0)'
]
,scales: {
xAxes: [{
display: true,
scaleLabel: {
display: true,
labelString: 'Wall Time'
}
}],
yAxes: [{
display: true,
scaleLabel: {
display: true,
labelString: 'CPU Num'
}
}]
}
});