| << Back to the reports page | >> To the Github repo of this page |
Latest update: 18 September 2024
This page shows reports and key figures generated by the GLAMorousToHTML tool for the partners of the Netwerk Digitaal Erfgoed (NDE), the Dutch network for digital heritage.
For the wider context and reports for other national and international institutions, see the GLAM reports page.
- Individual reports for NDE partners in the Dutch provinces and in Aruba
- Combined data
- Combined institutional data - Data from all individual NDE partner reports combined into one overall Excel and CSV file.
- Combined key figures - Key figures from the NDE partner reports combined into a single dataset (Excel and CSV).
- Publications related to GLAM report of NDE partners
- Fries Museum : Report for 04-09-2024
- Keramiekmuseum Princessehof : Report for 04-09-2024
- Tresoar Leeuwarden : Report for 04-09-2024
- Museumfederatie Fryslân : No images on Wikimedia Commons
- Stichting Erfgoed & Publiek : No images on Wikimedia Commons
- Groninger Archieven : Report for 04-09-2024
- DE REE archiefsystemen : No images on Wikimedia Commons
- Erfgoedpartners : No images on Wikimedia Commons

- Drents Archief : Report for 04-09-2024
- Herinneringscentrum Kamp Westerbork : Report for 04-09-2024
- Speelgoedmuseum Kinderwereld Roden : Report for 04-09-2024
- Stichting Hinsz-orgel Roden : Report for 04-09-2024
- Drentse Historische Vereniging : No images on Wikimedia Commons
- Erfgoednetwerk Emmen : No images on Wikimedia Commons
- Historische Vereniging Roon : No images on Wikimedia Commons
- Museum Havezate Mensinge : No images on Wikimedia Commons
- Scheepstra Kabinet : No images on Wikimedia Commons
- Collectie Overijssel : Report for 04-09-2024
- De Museumfabriek : Report for 04-09-2024
- Rijksmuseum Twenthe : Report for 04-09-2024
- Carnavalsmuseum de Hofnar : No images on Wikimedia Commons
- Het Palthe Huis : No images on Wikimedia Commons
- Museum de Pelgrim : No images on Wikimedia Commons
- Airborne Museum Hartenstein : Report for 04-09-2024
- Erfgoedcentrum Achterhoek en Liemers : Report for 04-09-2024
- Erfgoedcentrum Rozet : Report for 04-09-2024
- Gelders Archief : Report for 04-09-2024
- Kröller-Müller Museum : Report for 04-09-2024
- Museum Vliegbasis Deelen : Report for 04-09-2024
- Nederlands Openluchtmuseum : Report for 04-09-2024
- Radboud Universiteitsbibliotheek Nijmegen : Report for 04-09-2024
- Wereldmuseum Berg en Dal : Report for 04-09-2024
- Erfgoedcentrum Zutphen : No images on Wikimedia Commons
- Mobiele Collectie Nederland : No images on Wikimedia Commons
- Regionaal Archief Rivierenland : No images on Wikimedia Commons
- Seecr : No images on Wikimedia Commons
- Batavialand : Report for 04-09-2024
- Het Flevolands Archief : Report for 04-09-2024

- Het Utrechts Archief : Report for 04-09-2024
- Landhuis Oud Amelisweerd : Report for 04-09-2024
- Musiom, museum voor hedendaagse kunst : Report for 04-09-2024
- Rijksdienst voor het Cultureel Erfgoed : Report for 04-09-2024
- Universiteitsbibliotheek Utrecht : Report for 04-09-2024
- Universiteitsmuseum Utrecht : Report for 04-09-2024
- Archief Gooi en Vechtstreek : No images on Wikimedia Commons
- Axiell : No images on Wikimedia Commons
- DEVENTit : No images on Wikimedia Commons
- Landschap Erfgoed Utrecht : No images on Wikimedia Commons
- Nederlandse Genealogische Vereniging : No images on Wikimedia Commons
- Nederlandse Kastelenstichting : No images on Wikimedia Commons
- Nederlands Veteraneninstituut (NLVi) : No images on Wikimedia Commons
- Regionaal Historisch Centrum Vecht en Venen : No images on Wikimedia Commons
- Amsterdam Museum : Report for 04-09-2024
- Anne Frank Stichting : Report for 04-09-2024
- Atria, kennisinstituut voor emancipatie en vrouwengeschiedenis : Report for 04-09-2024
- Beeld & Geluid : Report for 04-09-2024
- Hollandsche Schouwburg : Report for 04-09-2024
- IHLIA LGBTI Heritage : Report for 04-09-2024
- Joods Museum : Report for 04-09-2024
- KVAN : Report for 04-09-2024
- KNAW Humanities Cluster
- IISG : Report for 04-09-2024
- Meertens Instituut : Report for 04-09-2024
- Huygens ING : No images on Wikimedia Commons
- Nationaal Holocaustmuseum : Report for 04-09-2024
- NEMO : Report for 04-09-2024
- Nederlands Scheepvaartmuseum : Report for 04-09-2024
- Netwerk Oorlogsbronnen : Report for 04-09-2024
- Noord-Hollands Archief : Report for 04-09-2024
- Portugese Synagoge : Report for 04-09-2024
- Regionaal Archief Alkmaar : Report for 04-09-2024
- Street Art Museum Amsterdam : Report for 04-09-2024
- Teylers Museum : Report for 04-09-2024
- Van Gogh Museum : Report for 04-09-2024
- Waterlands Archief : Report for 04-09-2024
- Wereldmuseum Amsterdam : Report for 04-09-2024
- Westfries Archief : Report for 04-09-2024
- DiVault : No images on Wikimedia Commons
- Driebit : No images on Wikimedia Commons
- Dynamisch Archief : No images on Wikimedia Commons
- Joods Cultureel Kwartier : No images on Wikimedia Commons
- Joods Museum Junior : No images on Wikimedia Commons
- Landelijk Coördinatiepunt Research Data Management : No images on Wikimedia Commons
- LI-MA : No images on Wikimedia Commons
- Picturae : No images on Wikimedia Commons
- Podiumkunst.net : No images on Wikimedia Commons
- Reinwardt Academie : No images on Wikimedia Commons
- Stichting Heineken Collection : No images on Wikimedia Commons
- Stichting Omroep Muziek : No images on Wikimedia Commons
- Total Design : No images on Wikimedia Commons
- Chabot Museum : Report for 04-09-2024
- DIG IT UP : Report for 04-09-2024
- Erfgoed Delft
- Stadsarchief Delft : Report for 04-09-2024
- Gemeentelijke monumenten Delft : Report for 04-09-2024
- Rijksmonumenten Delft : Report for 04-09-2024
- Archeologie Delft : No images on Wikimedia Commons
- Erfgoed Leiden en Omstreken : Report for 04-09-2024
- Erfgoedhuis Zuid-Holland : Report for 04-09-2024
- Expatriate Archive Centre : Report for 04-09-2024
- KB, nationale bibliotheek van Nederland : Report for 04-09-2024
- Kasteel Duivenvoorde : Report for 04-09-2024
- Kunstmuseum Den Haag : Report for 04-09-2024
- Literatuurmuseum : Report for 04-09-2024
- Maritiem Museum Rotterdam : Report for 04-09-2024
- Museon : Report for 04-09-2024
- Museum Rotterdam : Report for 04-09-2024
- Nationaal Archief : Report for 04-09-2024
- Nationaal Jenevermuseum Schiedam : Report for 04-09-2024
- Nederlands Fotomuseum : Report for 04-09-2024
- Rijksmuseum Boerhaave : Report for 04-09-2024
- Stedelijk Museum Schiedam : Report for 04-09-2024
- Streekarchief Midden-Holland : Report for 04-09-2024
- Universiteitsbibliotheek Leiden : Report for 04-09-2024
- Universiteitsbibliotheek TU Delft : Report for 04-09-2024
- Wereldmuseum Leiden : Report for 04-09-2024
- Wereldmuseum Rotterdam : Report for 04-09-2024
- Cit : No images on Wikimedia Commons
- Delving : No images on Wikimedia Commons
- DEN Kennisinstituut cultuur & digitale transformatie : No images on Wikimedia Commons
- Museum Engelandvaarders : No images on Wikimedia Commons
- Muziekweb : No images on Wikimedia Commons
- OCLC : No images on Wikimedia Commons
- Stichting Wijkcollectie Rotterdam : No images on Wikimedia Commons
- VHIC : No images on Wikimedia Commons
- DAF Museum Eindhoven : Report for 04-09-2024
- Museum 't Oude Slot : Report for 04-09-2024
- Regionaal Archief Tilburg : Report for 04-09-2024
- Stadsarchief Breda : Report for 04-09-2024
- Erfgoed Brabant : No images on Wikimedia Commons
- Erfgoed Brabant : No images on Wikimedia Commons
- Erfgoed 's-Hertogenbosch : No images on Wikimedia Commons
- Heemkring Molenheide (Gilze en Rijen) : No images on Wikimedia Commons
- Maritiem MuZEEum Zeeland : Report for 04-09-2024
- Museum Het Bolwerk : Report for 04-09-2024
- ZB Bibliotheek van Zeeland : Report for 04-09-2024
- Zeeuws Archief : Report for 04-09-2024
- Erfgoed Zeeland : No images on Wikimedia Commons
- Discovery Museum Kerkrade : Report for 04-09-2024
- Keramiekcentrum Tiendschuur Tegelen : Report for 04-09-2024
- Limburgs Museum : Report for 04-09-2024
- Missiemuseum Steyl : Report for 04-09-2024
- Sociaal Historisch Centrum voor Limburg : Report for 04-09-2024
- Universiteitsbibliotheek Maastricht : Report for 04-09-2024
- Huis voor de Kunsten Limburg : No images on Wikimedia Commons
- Kleksi/Sofco : No images on Wikimedia Commons
- Archivo Nacional Aruba : Report for 04-09-2024
- Biblioteca Nacional Aruba : Report for 04-09-2024
- Coleccion Aruba : No images on Wikimedia Commons
- Union di Organisacionnan Cultural Arubano (UNOCA) : No images on Wikimedia Commons
The individual Excel files for all NDE partners have been combined into a single overall Excel file, which has also been converted to a CSV file.
You can download this combined data in two formats:
- CSV: 04-09-2024
- Excel: 04-09-2024
- Both files can also be downloaded directly from the data/nde/aggregated folder in the repo.
Please note that the individual Excel file are accessible from the HTML reports above, or directly from the data/nde folder in the repo.
The key figures from the individual NDE partner reports have been combined into a single dataset. These key figures are represented by the column names explained below.
You can download these combined key figures in two formats:
- CSV: 04-09-2024
- Excel: 04-09-2024
- Both files can also be downloaded directly from the reports/ folder in the repo
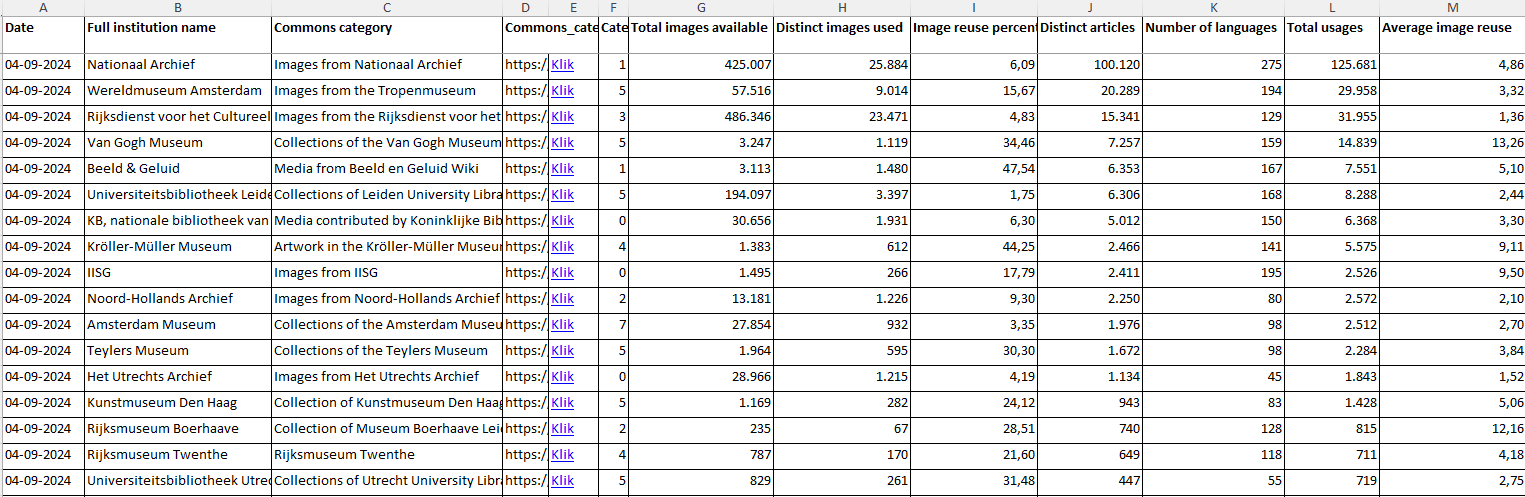
- Date: The date on which the report was generated.
- Example: 04-09-2024
- Full institution name: The full/official name of the institution
- Example: Universiteitsbibliotheek Leiden
- Commons category: The main category on Wikimedia Commons containing the images related to the (collections of the) institution.
- Example: Collections of Leiden University Library
- Commons category URL: The full URL of this category, with spaces replaced by underscores.
- Category depth: The level of subcategories that are taken into account for the report. This is an input paramater of the GLAMorous tool.
- Examples: 0 (no subcategories, only images in the main category are used), 1 (all first level subcategories) etc.
- Total images available: The total number of images available in the main category and its tree of subcategories (as specified by the category depth).
- Example: 194.097
- Distinct images used: The unique/distinct number of images from this category tree that are used in Wikipedia articles (all language versions).
- Example: 3.397
- Image reuse percentage: The percentage of the available images that are actually used in Wikipedia articles. This is a measure for the uptake of the images.
- Example: (3.397/194.097) * 100 = 1.75%
- Distinct articles: The number of unique/distinct Wikipedia articles (all language versions) that are illustrated by (one or more) images from the category tree.
- Example: 6.306
- Number of languages: The number of Wikipedia language versions in which images from the category tree are used.
- Example: 168
- Total usages: The total number of times that images from the category tree show up in Wikipedia articles, in all language versions. This is different from 'Distinct articles', as a single image can illustrate multiple articles and v.v, one article can contain multiple images. For illustration, see this easy example.
- Example: 8.288
- Average image reuse: The average number of times a single image is used to illustrate an article. This is 'Total usages' divided by 'Distinct images used'. This is a measure for the outreach effectiveness of the images that are used in Wikipedia articles. For example, if we look at the Wereldmuseum Rotterdam, we see that only 3 of their images show up in articles 79 times, resulting in an average image reuse of 79/3 = 26.33. These couple of images are very effective in their reach and are seen worldwide! At the other end of the spectrum is the Rijksdienst voor het Cultureel Erfgoed; their 23.471 distinct images 'only' have 31.955 usages, making this number equal 1.36.
- Example: 8.288/3.397 = 2.44
- HTML URL: URL of the report for the specified date (04-09-2024)
- Excel URL: URL of the corresponding Excel file of the specified date (04-09-2024). This file shows which exact images are used per article.
- Test story with Datawrapper interactive visuals
- Voor elke NDE partner, welk artikel heeft de meeste beelden van/uit/over die instelling? In welke taalversie is dat artikel