This project has two parts: In the first portion, I created a Python script to visualize the weather of 500+ cities across the world of varying distance from the equator, utilizing a simple Python library, the OpenWeatherMap API, and a little common sense to create a representative model of weather across world cities. The first requirement was to create a series of scatter plots to showcase the following relationships:
- Temperature (F) vs. Latitude
- Humidity (%) vs. Latitude
- Cloudiness (%) vs. Latitude
- Wind Speed (mph) vs. Latitude
The second requirement is to run linear regression on each relationship. This time, separate the plots into Northern Hemisphere (greater than or equal to 0 degrees latitude) and - - Southern Hemisphere (less than 0 degrees latitude):
- Northern Hemisphere - Temperature (F) vs. Latitude
- Southern Hemisphere - Temperature (F) vs. Latitude
- Northern Hemisphere - Humidity (%) vs. Latitude
- Southern Hemisphere - Humidity (%) vs. Latitude
- Northern Hemisphere - Cloudiness (%) vs. Latitude
- Southern Hemisphere - Cloudiness (%) vs. Latitude
- Northern Hemisphere - Wind Speed (mph) vs. Latitude
- Southern Hemisphere - Wind Speed (mph) vs. Latitude In the final notebook, I:
- Randomly selected at least 500 unique (non-repeat) cities based on latitude and longitude.
- Performed a weather check on each of the cities using a series of successive API calls.
- Included a print log of each city as it's being processed with the city number and city name.
- Saved a CSV of all retrieved data and a PNG image for each scatter plot.
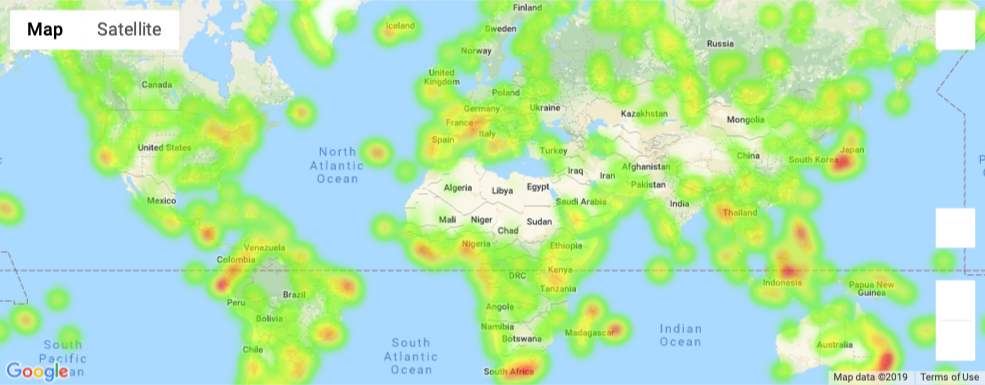
In the second part of the assignment, I
- Create a heat map that displays the humidity for every city from Part I.
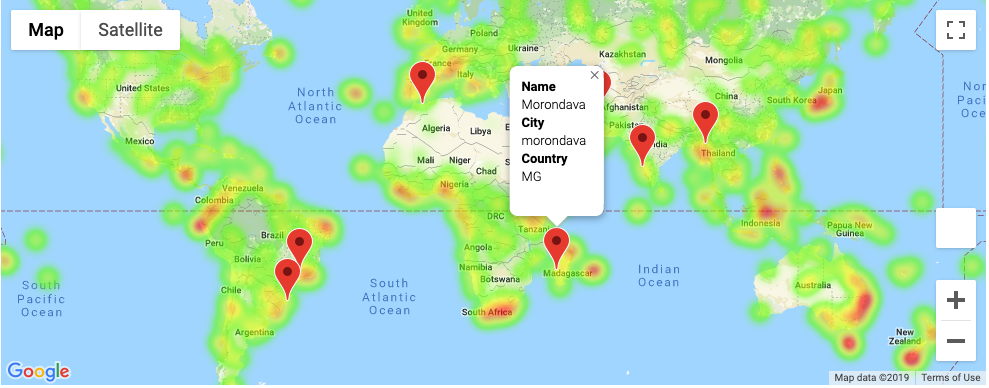
- Narrow down the DataFrame to find your ideal weather condition. For example:
- A max temperature lower than 80 degrees but higher than 70.
- Wind speed less than 10 mph.
- Zero cloudiness.
- Drop any rows that don't contain all three conditions. You want to be sure the weather is ideal.
- Using Google Places API to find the first hotel for each city located within 5000 meters of your coordinates.
- Plot the hotels on top of the humidity heatmap with each pin containing the Hotel Name, City, and Country.